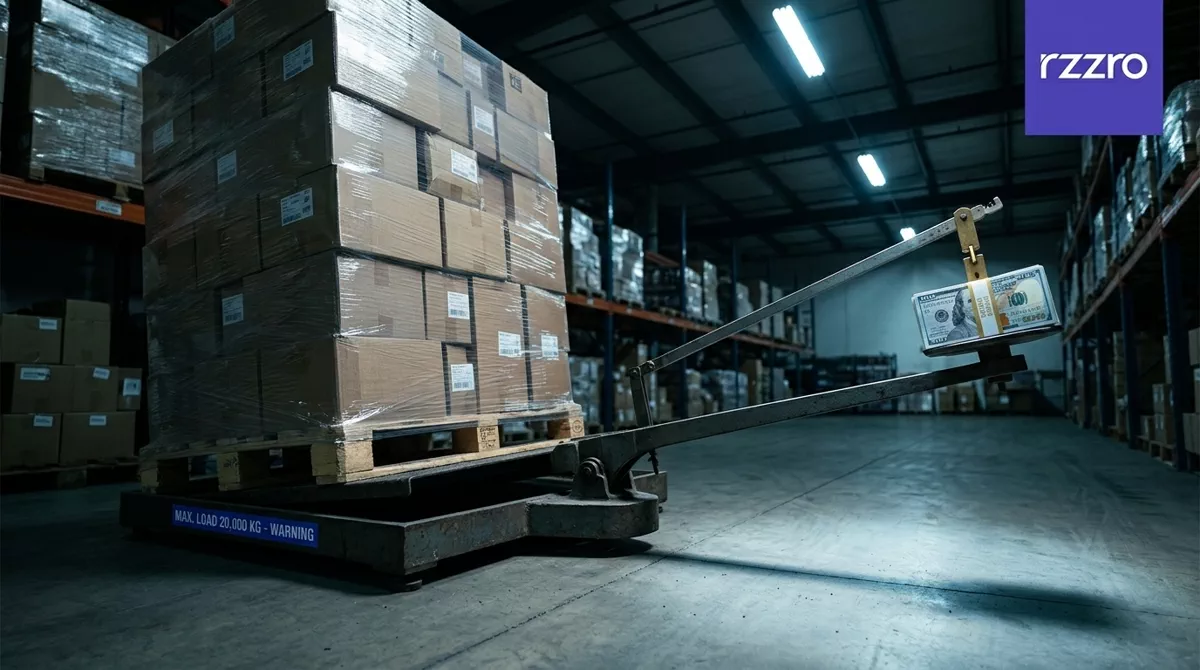
The myth is simple and seductive: buy more, pay less per unit, and save money. The supplier offers 10% off if you take 3,000 units instead of 1,000. The spreadsheet shows $30,000 in purchase savings. The procurement manager looks smart. The finance team signs off. The warehouse fills up.
What the spreadsheet does not show: those extra 2,000 units will sit in inventory for six months, consuming warehouse space, insurance, and working capital at an annual carrying cost of 20-30%. At 25%, that is $33,750 in holding costs against $30,000 in savings. The discount did not save money. It cost $3,750 — before a single unit became obsolete.
Why the myth has a valid origin
Volume discounts are not irrational. For stable, high-turnover commodities with predictable demand, buying in larger quantities does reduce per-unit acquisition cost, and the goods sell before carrying costs accumulate. A manufacturer consuming 10,000 identical fasteners per week with a reliable forecast can safely take the volume discount — the inventory turns 52 times per year.
The myth persists because procurement performance is typically measured on purchase price variance — the difference between what you paid and what you budgeted. A 10% discount is immediately visible in the PPV report. The carrying costs that consume it over the following six months appear in warehousing, working capital, and write-off line items that nobody connects back to the purchasing decision.
Where it breaks down: the carrying cost math
Inventory carrying cost is not one number. It compounds four independent cost streams. Capital cost at 10-15% — the cash tied up in inventory that could fund growth, pay down debt, or earn a return elsewhere. Storage and warehousing at 5-8% — rent, utilities, labor, equipment. Service costs at 3-5% — insurance, taxes, inventory management systems. Risk costs at 2-5% — obsolescence, shrinkage averaging 1.4% of retail sales, damage, depreciation.
A firm with 3× annual inventory turnover (120-day holding period) pays four times the carrying cost of a firm with 12× turnover (30-day holding). The volume discount forces slower turnover. The slower turnover compounds carrying costs. The discount disappears.
1,000 units × $100 = $100,000. 2-month hold: $4,170 carrying cost. Total: $104,170.
3,000 units × $90 (10% discount) = $270,000. 6-month hold: $33,750 carrying cost. Total: $303,750.
Net result: discount costs $3,750 more.
Commit to 3,000 units at the discounted $90/unit price. Supplier ships 500 units monthly against the blanket order. You get the 10% discount, maintain 1-month inventory, and pay $5,625 in carrying costs. Total: $275,625.
Net result: saves $28,125 vs. bulk delivery.
The hidden costs most buyers skip
Working capital is the first casualty. Bulk purchasing converts cash into inventory that cannot be converted back until it sells. A $270,000 purchase with six months of holding ties up capital equal to the company's cost of capital for the entire period. If the business has a 12% cost of capital, that is $16,200 in opportunity cost — even before warehousing, insurance, or obsolescence.
Obsolescence is the second. Kitchen appliance buyers who chased volume discounts ended up with "increased inventory costs, higher storage requirements, cash-flow constraints, and product obsolescence risk from design and feature changes." Fashion brands routinely see 20-30% of end-of-season inventory become obsolete. Electronics distributors face component obsolescence within 12-18 months. A volume discount on a product that becomes obsolete before it sells is not a discount — it is a guaranteed write-off.
Minimum order quantities amplify both risks. MOQs are the mechanism suppliers use to enforce volume discount tiers, and they are set for the supplier's profitability, not the buyer's optimal order size. The gap between the supplier's MOQ and your Economic Order Quantity (EOQ) is the negotiation starting point, but most buyers accept the MOQ as a condition of the discount without calculating whether the extra inventory can be consumed before the carrying costs offset the savings.
What replaces discount-chasing
Smart volume buying uses Total Cost of Ownership as the decision metric, not unit price. For each discount tier, calculate the total annual cost: purchase cost plus ordering cost plus holding cost. The quantity with the lowest total cost wins — even if the unit price is not the lowest.
Calculate EOQ with quantity discounts. The standard EOQ formula — Q = √(2DS/H), where D is annual demand, S is ordering cost per order, and H is holding cost per unit per year — provides the baseline. For volume discounts, run the formula at each price break and compare total annual cost across all tiers. The quantity that minimizes total cost rarely matches the supplier's preferred discount tier.
Blanket purchase orders capture the discount without the inventory. A mechanical engineering company consolidated demand for 2.4 million standard screws with one supplier via a blanket PO: achieved an 18% quantity discount while reducing transaction costs by 35% — without inflating on-hand inventory. The supplier ships against the blanket as needed. The buyer gets the volume price. The warehouse does not fill up.
What correct execution looks like
Companies using TCO-based procurement achieve up to 30% cost savings over three years according to Supply Chain Management Review data. The savings come from three shifts: inventory turns increase, working capital requirements decline, and write-offs drop. A documented nearshore-vs-offshore TCO case compared an Asian supplier with an 8-week lead time against a nearshore alternative with a higher unit price but lower freight, lower inventory, and fewer expedites. The nearshore TCO was $1.07/unit against the Asian supplier's $1.11/unit — the higher-priced option won on total cost.
The discipline is cross-functional. Procurement, finance, and operations must share a single TCO model that makes carrying costs, obsolescence risk, and working capital impact visible at the point of the purchasing decision. Without that visibility, the PPV incentive structure will always favor the volume discount — and the P&L will absorb the carrying costs elsewhere.
What this means in practice
Audit your last three volume discount purchases. For each, calculate the actual carrying cost from purchase date to consumption date. Compare the discount savings to the carrying cost. If the carrying cost exceeded the savings on any of them, the discount was not a saving — it was an inventory financing arrangement disguised as procurement performance.
Build a one-page TCO calculator for your top five volume discount categories. Include purchase price, freight, estimated holding period, carrying cost rate (use 25% as a starting benchmark), and obsolescence risk factor. Run it before every bulk purchasing decision. The calculator takes 30 minutes to build and prevents six-figure inventory mistakes.
Negotiate blanket POs instead of bulk deliveries. Commit to the volume. Get the discount. Schedule deliveries against actual demand. The supplier gets the revenue commitment. You get the price and keep the warehouse empty. This is not a procurement hack — it is standard practice in organizations that measure total cost, not purchase price.
Frequently asked questions
When do volume discounts actually cost more?
Volume discounts cost more when the inventory carrying cost (20-30% of purchase value per year) exceeds the discount savings. A 10% discount on 3,000 units produces $30,000 in purchase savings but $33,750 in carrying costs at 25% annual rate over a six-month hold — a net loss of $3,750 before obsolescence or write-offs.
What is the true cost of holding extra inventory?
Inventory carrying costs range from 20-30% annually and include four components: capital cost (10-15% for tied-up cash and opportunity cost), storage and warehousing (5-8%), insurance and taxes (3-5%), and obsolescence plus shrinkage (2-5%). A $500,000 inventory position costs $100,000-150,000 per year to maintain before a single unit is sold.
How should buyers evaluate volume discount offers?
Calculate total annual cost at each price break: purchase cost plus ordering cost plus holding cost. Use the Economic Order Quantity (EOQ) formula adjusted for quantity discounts. Compare the lowest total cost — not the lowest unit price. Blanket purchase orders capture the discount without the inventory by committing to volume but scheduling deliveries against actual demand.
Data sources
- Smart Procurement — Why Volume Discounts Don't Always Work in Corporate Procurement. Accessed July 16, 2026.
- NetSuite — Inventory Carrying Costs: Complete Guide. Accessed July 16, 2026.
- Institute for Supply Management — Total Cost of Ownership in Procurement. Accessed July 16, 2026.
- Umbrex — Total Cost of Ownership Framework and Case Studies. Accessed July 16, 2026.
- Tacto — Quantity Discount in Procurement: When Volume Buying Makes Sense. Accessed July 16, 2026.
- Tacto — Volume Discount Glossary: Blanket Purchase Order Case Study. Accessed July 16, 2026.