Download PNG (2x Retina)
Education — Framework

Supplier scorecards: how to build one that actually changes behavior

Most scorecards measure compliance. The ones that change supplier behavior are built around 5–7 strategic KPIs, real-time data, and collaborative improvement — not quarterly punishment.
12%
Average cost savings from structured vendor evaluation (ISM)
30%
Fewer late deliveries with signal-to-action scorecards (Ivalua)
77%
Suppliers say scorecards improve their own operations (RadiusPoint/ISM)
ROI ratio for world-class procurement (Hackett Group)

Scorecards evolve by accumulation, not design. Within two years, a scorecard that started with eight KPIs has forty-seven — at which point the scorecard communicates nothing. Suppliers cannot determine what matters. Business units cannot distinguish signal from noise.

❌ Compliance Scorecard
  • 40+ KPIs — accumulation by department, not design
  • Quarterly cycle — data is weeks old by review time
  • Fragmented data — reconciled manually across 7+ systems
  • Opaque scoring — no rubric; supplier cannot predict score
  • Punishment tool — used to identify suppliers for termination
✓ Behavior-Change Scorecard
  • 5–7 weighted KPIs — signals what the buyer actually values
  • Real-time signaling — anomalies surfaced immediately (Signal-to-Action)
  • Integrated data — automated across ERP, AP, QMS, logistics
  • Defined rubrics — explicit 1–5 definitions with examples
  • Improvement tool — collaboration not termination; forward-looking indicators
01
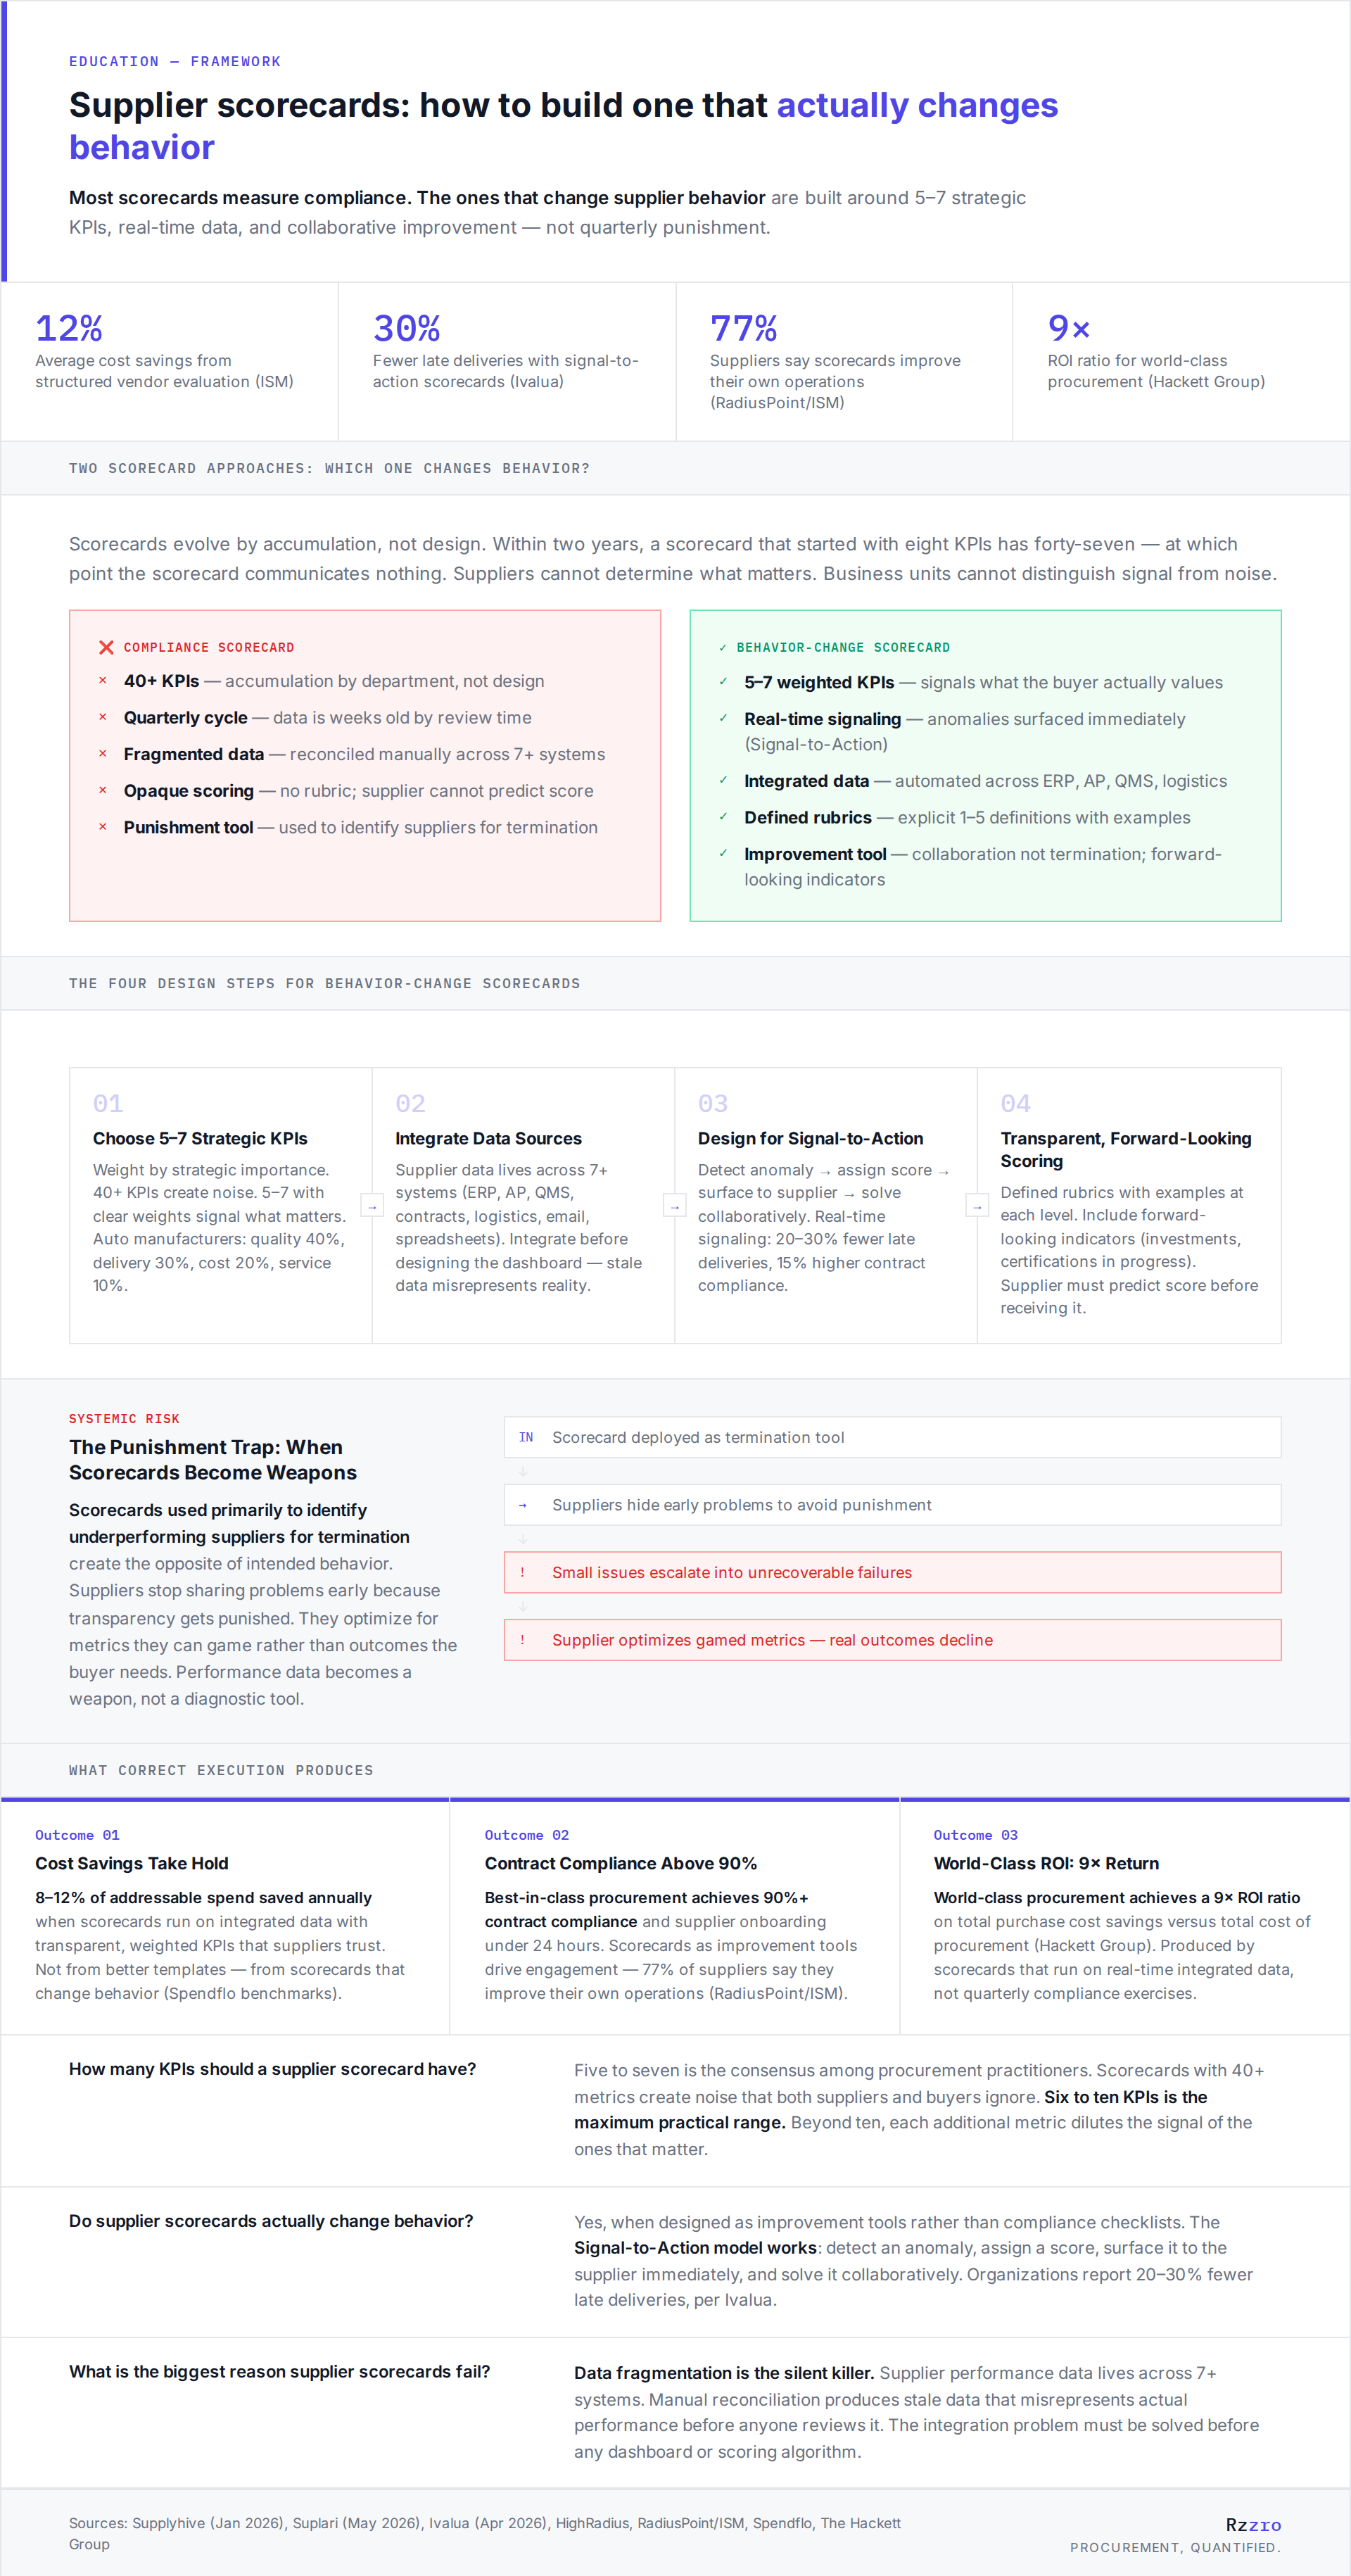
Choose 5–7 Strategic KPIs
Weight by strategic importance. 40+ KPIs create noise. 5–7 with clear weights signal what matters. Auto manufacturers: quality 40%, delivery 30%, cost 20%, service 10%.
02
Integrate Data Sources
Supplier data lives across 7+ systems (ERP, AP, QMS, contracts, logistics, email, spreadsheets). Integrate before designing the dashboard — stale data misrepresents reality.
03
Design for Signal-to-Action
Detect anomaly → assign score → surface to supplier → solve collaboratively. Real-time signaling: 20–30% fewer late deliveries, 15% higher contract compliance.
04
Transparent, Forward-Looking Scoring
Defined rubrics with examples at each level. Include forward-looking indicators (investments, certifications in progress). Supplier must predict score before receiving it.
Systemic Risk
The Punishment Trap: When Scorecards Become Weapons
Scorecards used primarily to identify underperforming suppliers for termination create the opposite of intended behavior. Suppliers stop sharing problems early because transparency gets punished. They optimize for metrics they can game rather than outcomes the buyer needs. Performance data becomes a weapon, not a diagnostic tool.
IN Scorecard deployed as termination tool
Suppliers hide early problems to avoid punishment
! Small issues escalate into unrecoverable failures
! Supplier optimizes gamed metrics — real outcomes decline
Outcome 01
Cost Savings Take Hold
8–12% of addressable spend saved annually when scorecards run on integrated data with transparent, weighted KPIs that suppliers trust. Not from better templates — from scorecards that change behavior (Spendflo benchmarks).
Outcome 02
Contract Compliance Above 90%
Best-in-class procurement achieves 90%+ contract compliance and supplier onboarding under 24 hours. Scorecards as improvement tools drive engagement — 77% of suppliers say they improve their own operations (RadiusPoint/ISM).
Outcome 03
World-Class ROI: 9× Return
World-class procurement achieves a 9× ROI ratio on total purchase cost savings versus total cost of procurement (Hackett Group). Produced by scorecards that run on real-time integrated data, not quarterly compliance exercises.
How many KPIs should a supplier scorecard have?
Five to seven is the consensus among procurement practitioners. Scorecards with 40+ metrics create noise that both suppliers and buyers ignore. Six to ten KPIs is the maximum practical range. Beyond ten, each additional metric dilutes the signal of the ones that matter.
Do supplier scorecards actually change behavior?
Yes, when designed as improvement tools rather than compliance checklists. The Signal-to-Action model works: detect an anomaly, assign a score, surface it to the supplier immediately, and solve it collaboratively. Organizations report 20–30% fewer late deliveries, per Ivalua.
What is the biggest reason supplier scorecards fail?
Data fragmentation is the silent killer. Supplier performance data lives across 7+ systems. Manual reconciliation produces stale data that misrepresents actual performance before anyone reviews it. The integration problem must be solved before any dashboard or scoring algorithm.
Sources: Supplyhive (Jan 2026), Suplari (May 2026), Ivalua (Apr 2026), HighRadius, RadiusPoint/ISM, Spendflo, The Hackett Group
Rzzro
Procurement, quantified.