Download PNG (960×1440)
Education — Mental Model

The Bullwhip Effect: Why Small Forecast Errors Cascade

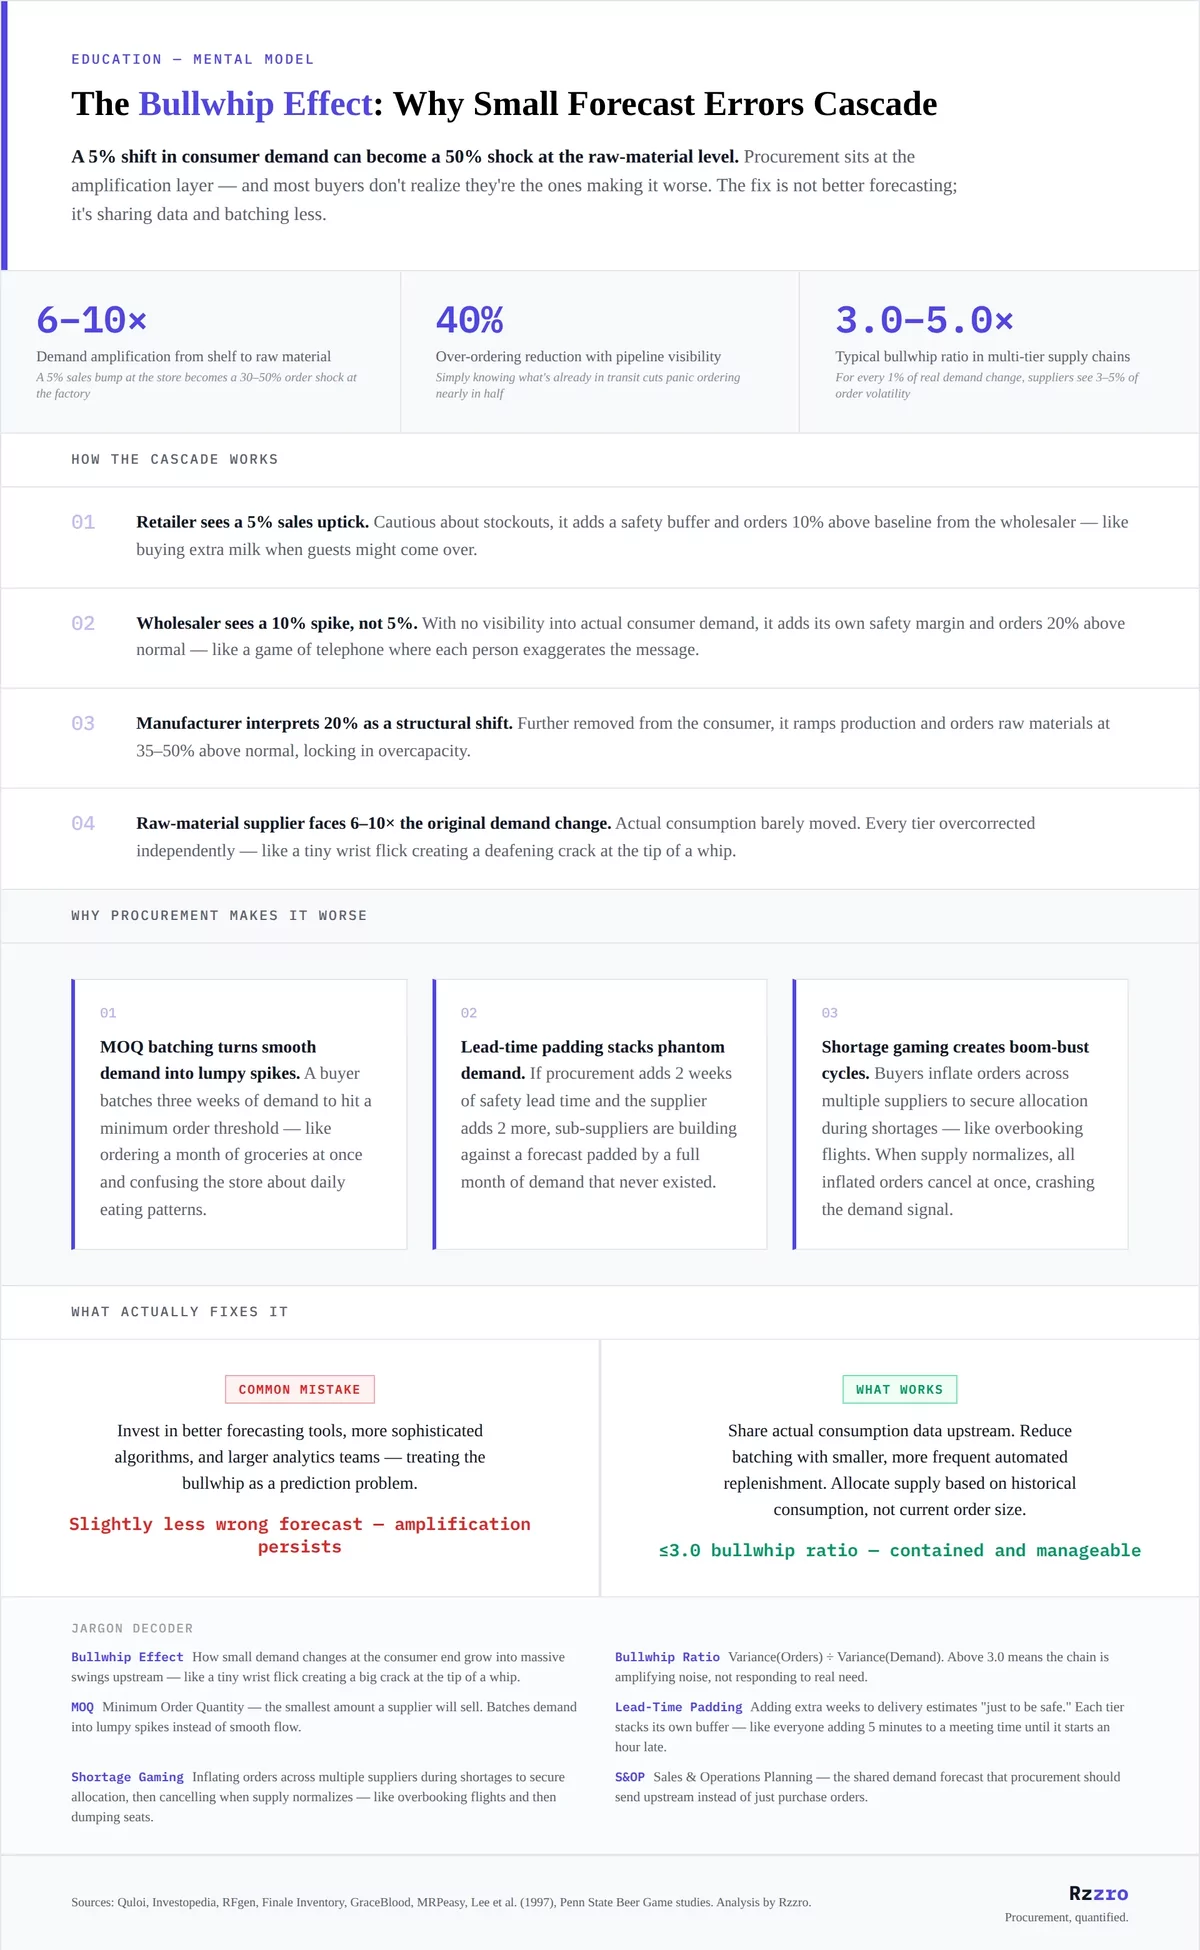
A 5% shift in consumer demand can become a 50% shock at the raw-material level. Procurement sits at the amplification layer — and most buyers don't realize they're the ones making it worse. The fix is not better forecasting; it's sharing data and batching less.
6–10×
Demand amplification from shelf to raw material
A 5% sales bump at the store becomes a 30–50% order shock at the factory
40%
Over-ordering reduction with pipeline visibility
Simply knowing what's already in transit cuts panic ordering nearly in half
3.0–5.0×
Typical bullwhip ratio in multi-tier supply chains
For every 1% of real demand change, suppliers see 3–5% of order volatility
01
Retailer sees a 5% sales uptick. Cautious about stockouts, it adds a safety buffer and orders 10% above baseline from the wholesaler — like buying extra milk when guests might come over.
02
Wholesaler sees a 10% spike, not 5%. With no visibility into actual consumer demand, it adds its own safety margin and orders 20% above normal — like a game of telephone where each person exaggerates the message.
03
Manufacturer interprets 20% as a structural shift. Further removed from the consumer, it ramps production and orders raw materials at 35–50% above normal, locking in overcapacity.
04
Raw-material supplier faces 6–10× the original demand change. Actual consumption barely moved. Every tier overcorrected independently — like a tiny wrist flick creating a deafening crack at the tip of a whip.
01
MOQ batching turns smooth demand into lumpy spikes. A buyer batches three weeks of demand to hit a minimum order threshold — like ordering a month of groceries at once and confusing the store about daily eating patterns.
02
Lead-time padding stacks phantom demand. If procurement adds 2 weeks of safety lead time and the supplier adds 2 more, sub-suppliers are building against a forecast padded by a full month of demand that never existed.
03
Shortage gaming creates boom-bust cycles. Buyers inflate orders across multiple suppliers to secure allocation during shortages — like overbooking flights. When supply normalizes, all inflated orders cancel at once, crashing the demand signal.
Common Mistake
Invest in better forecasting tools, more sophisticated algorithms, and larger analytics teams — treating the bullwhip as a prediction problem.
Slightly less wrong forecast — amplification persists
What Works
Share actual consumption data upstream. Reduce batching with smaller, more frequent automated replenishment. Allocate supply based on historical consumption, not current order size.
≤3.0 bullwhip ratio — contained and manageable
Jargon Decoder
Bullwhip Effect How small demand changes at the consumer end grow into massive swings upstream — like a tiny wrist flick creating a big crack at the tip of a whip.
Bullwhip Ratio Variance(Orders) ÷ Variance(Demand). Above 3.0 means the chain is amplifying noise, not responding to real need.
MOQ Minimum Order Quantity — the smallest amount a supplier will sell. Batches demand into lumpy spikes instead of smooth flow.
Lead-Time Padding Adding extra weeks to delivery estimates "just to be safe." Each tier stacks its own buffer — like everyone adding 5 minutes to a meeting time until it starts an hour late.
Shortage Gaming Inflating orders across multiple suppliers during shortages to secure allocation, then cancelling when supply normalizes — like overbooking flights and then dumping seats.
S&OP Sales & Operations Planning — the shared demand forecast that procurement should send upstream instead of just purchase orders.
Sources: Quloi, Investopedia, RFgen, Finale Inventory, GraceBlood, MRPeasy, Lee et al. (1997), Penn State Beer Game studies. Analysis by Rzzro.
Rzzro
Procurement, quantified.