Every sourcing event includes a comparison. Price, delivery terms, lead time. But one number is almost always missing from the calculation: total cost of ownership.
The problem is not that buyers do not know about TCO. Most category managers have heard the term and can define it in a meeting. The problem is they calculate only two or three cost layers and call it a day. The Hackett Group found that fewer than 30% of organizations incorporate non-acquisition costs into their supplier selection decisions. The 70% who skip the deeper layers are not making mistakes at the margin. They are making the wrong decision 30 to 40 percent of the time, depending on the category.
This article covers the four cost layers most buyers exclude, why each matters, and how to incorporate them into evaluation without a full-time cost modeling team.
The cost layer most buyers do count: acquisition price
Every supplier comparison starts with the unit price. This is the one number everyone agrees on. It is clean. It is comparable. It fits in a spreadsheet column. The problem is not that buyers count acquisition price. The problem is they stop there.
Acquisition price typically accounts for 50 to 70 percent of total lifecycle cost in direct material categories and 40 to 60 percent in indirect categories, according to research from the Institute for Supply Management. That leaves 30 to 60 percent of actual cost invisible to anyone who looks only at the price column.
Layer 1: transaction processing costs
Every supplier relationship generates administrative work. Purchase orders are created, invoices are matched, goods are received, payments are processed. The American Productivity and Quality Center estimates the average cost of processing a single purchase order at $45 to $120, including procurement, accounts payable, and receiving labor.
The range matters more than the average. Suppliers with complex pricing structures, frequent change orders, or non-standard invoicing can double the per-order cost. A supplier with a clean catalog feed, automated invoicing, and stable pricing can halve it. Over a year of recurring orders, this difference alone can shift the total cost comparison by 2 to 5 percent of spend.
Most buyers exclude this layer because the cost is buried in operational budgets and never attributed to the supplier. Procurement sees the unit price. Accounts payable sees the invoice volume. Receiving sees the exceptions. No single person sees the total.
Layer 2: quality and defect costs
Defects produce cost long before anyone files a return. Incoming inspection, line stoppages, rework, scrap, expedited replacement orders, customer penalties if the defect reaches the end customer. The American Society for Quality estimates the cost of poor quality at 10 to 15 percent of revenue for most manufacturing organizations. In procurement terms, that means a significant share of that cost traces back to supplier quality.
Buyers who exclude this layer are implicitly assuming all suppliers deliver at the same quality level. They do not. A supplier with a 1 percent defect rate and a supplier with a 5 percent defect rate look identical on the price sheet. The second supplier adds three to four times the defect cost. In categories where defects cause line stoppages, the multiplier is larger. A 30-minute production line halt at an automotive plant costs $10,000 to $30,000 per minute, according to an industry benchmark. At those figures, a single defect event from a low-price supplier can erase a year of unit-price savings.
Layer 3: logistics and inventory carrying costs
How a supplier delivers affects more than freight charges. Long lead times require higher safety stock. Unreliable delivery requires buffer inventory. Minimum order quantities that exceed actual consumption generate excess inventory that sits in the warehouse for months.
The cost of carrying inventory includes the cost of capital (typically 5 to 8 percent), storage space, insurance, obsolescence risk, and shrinkage. A widely used benchmark from the Council of Supply Chain Management Professionals puts total inventory carrying cost at 18 to 25 percent of inventory value per year.
A supplier with a weekly lead time and 90 percent on-time delivery requires far less safety stock than a supplier with a six-week lead time and 70 percent on-time delivery. The difference in carrying cost can be 3 to 5 percent of annual spend in high-value categories. This layer alone can reverse a supplier ranking that looked settled on price alone.
Layer 4: end-of-life and transition costs
When a supplier relationship ends, or a product lifecycle ends, cost does not stop. Disposal of obsolete inventory, decommissioning of supplier-specific tooling, data migration, contract exit fees, and warranty liability all carry real expense.
In IT and industrial equipment procurement, end-of-life costs can reach 10 to 20 percent of the original acquisition value, according to Gartner research. A server or a custom-manufactured component that requires supplier-specific disposal processes is not just more expensive to buy. It is more expensive to get rid of. Buyers who switch suppliers every two years without accounting for transition costs are systematically choosing suppliers that look cheap on day one and become expensive on day 730.
The failure mode: collapsing TCO to a single number
The most common failure in TCO analysis is not that buyers skip layers. It is that they attempt to collapse everything into a single weighted score and the exercise becomes divorced from operational reality. The process produces a number that looks precise but is built on assumptions nobody validated.
The correct approach is not a single TCO score. It is a side-by-side comparison of the four layers, each estimated with a defensible range, not a point estimate. The Hackett Group recommends using a 5-year time horizon for most capital and indirect categories and a 3-year horizon for direct materials. Within each horizon, estimate each cost layer as a low, medium, and high scenario. If the supplier ranking changes across scenarios, the decision requires more data before award, not more arithmetic.
What correct execution looks like
Organizations that do TCO correctly share three patterns. First, they build the cost model before they issue the RFQ, not after responses come in. The template exists before suppliers submit pricing, so the comparison is structured from the start.
Second, they collect data for each layer from the function that owns it. Procurement does not estimate transaction cost. Accounts payable provides it. Quality does not estimate defect cost. The quality team provides field failure data. Logistics does not estimate carrying cost. Supply chain provides inventory turns and carrying rates.
Third, they use the TCO model to negotiate, not just to select. When a supplier ranks second on unit price but first on TCO, the buyer can show the high-price supplier exactly where their cost advantage is hiding. That transparency shifts the negotiation from price pressure to value alignment.
What this means in practice
- Audit your last five supplier selections. Compare the decision that unit price alone would have produced against the decision under a four-layer TCO model. If the ranking changes in at least two of five, you have a systematic blind spot.
- Build a simple TCO template before your next RFQ. Four rows: acquisition price, transaction cost, quality cost, logistics and inventory cost. Use ranges, not point estimates.
- Pull actual data from the function that owns each layer before the supplier evaluation meeting. Do not ask procurement to estimate quality cost. Ask quality.
- Use the 5-year horizon for capital equipment and indirect services. A supplier with higher setup cost and lower annual cost rarely wins in a 1-year comparison but often wins at 5 years.
- When the TCO model shows a different winner than the unit price column, do not discard the model. Investigate the gap. It is telling you something the price column hides.
What is total cost of ownership in procurement?
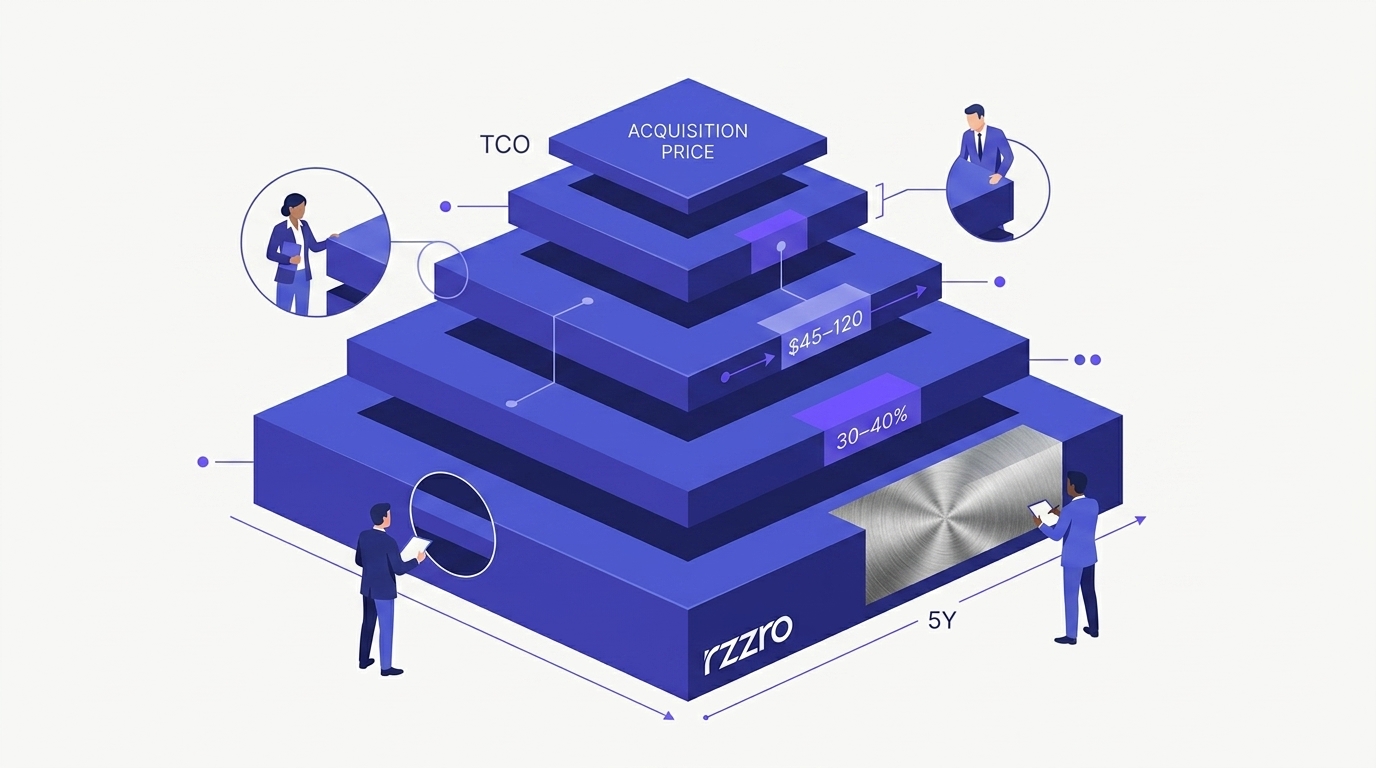
Total cost of ownership is the complete lifecycle cost of a product or supplier relationship, including acquisition price, transaction processing costs, quality and defect costs, logistics and inventory carrying costs, and end-of-life disposal. Most organizations only calculate the purchase price, missing 30 to 50 percent of actual costs. TCO analysis changes the winning supplier in 30 to 40 percent of evaluations, according to multiple studies.
Which cost layers do most buyers exclude from TCO?
Most buyers exclude transaction processing costs (administrative work per purchase order, estimated at $45 to $120 per PO), quality and defect costs (scrap, rework, returns, line stoppages), logistics and inventory carrying costs (warehousing, obsolescence, cost of capital), and end-of-life disposal or transition costs. These four layers typically account for 30 to 50 percent of total lifecycle cost.
Sources
- The Hackett Group — Procurement Benchmarks
- Institute for Supply Management — TCO Research
- American Productivity and Quality Center — Transaction Cost Benchmarks
- American Society for Quality — Cost of Poor Quality
- Council of Supply Chain Management Professionals — State of Logistics Report
- Gartner — Supply Chain Technology and Costs Research