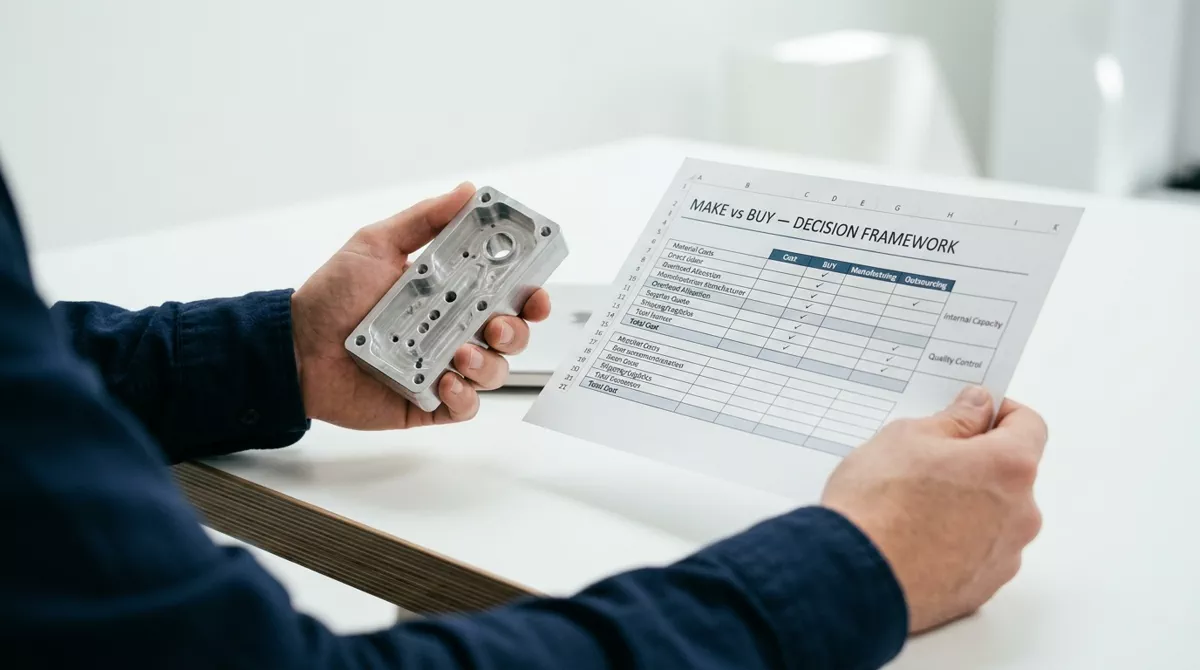
A manufacturer I worked with spent three months negotiating an outsourcing deal for a subassembly that saved 12% on unit price. Two years later, total cost was 18% higher than internal production. The analysis had compared marginal internal cost against the supplier's fully loaded price — an apples-to-oranges comparison that made outsourcing look cheaper than it actually was. No one had run the numbers again until the category review uncovered the gap.
Make-vs-buy is procurement's highest-stakes structural decision. Get it right and you reallocate capital to where it creates advantage. Get it wrong and you hemorrhage margin, lose critical capability, or lock into supplier relationships you cannot unwind without paying twice. Yet most organizations run it as a cost-comparison exercise when it should be run as a strategic decision, per the framework laid out by Trace Consultants and validated against multiple operational sources.
The unit-price comparison trap
Treating make-vs-buy as a narrow cost exercise is the single biggest failure mode, confirmed across every verified source. The pattern has three variants. First, internal advocates compare marginal internal cost — direct labor plus materials — against the supplier's fully loaded external price, omitting overhead, machine amortization, quality failure costs, and management time on the internal side. Second, the "buy" case omits transaction costs that add 1% to over 8% of contract value depending on batch complexity (Balaeva et al., 2020, Public Money & Management), supply disruption risk, and buffer inventory carrying costs at 15% to 25% per year. Third, the analysis runs as a single deterministic business case: no scenario testing for demand swings, no FX shift modeling, no supplier failure simulation.
A worked example from Supply Chain Math illustrates the gap. Raw unit price: internal €6.90, external €5.30 — outsourcing looks €1.60 cheaper per unit. Full TCO comparison including overhead, capital, inventory, management, quality, and risk costs: internal €8.50, external €8.25 — a marginal difference that makes neither option clearly dominant. At 500,000 units per year, the unit-price comparison was wrong by €1.35 per unit, or €675,000 annually in a single component category.
The five-step framework
Drawing from ITER Consulting's three-dimension model and Supply Chain Math's step-by-step methodology, here is the structured approach that replaces unit-price comparisons with strategic evaluation.
Step 1: Define scope precisely
Specify exactly what is being evaluated — component, assembly, service, process. Define the volume range, quality specifications, lead time requirements, and service levels as non-negotiable constraints. The most common scope error is comparing internal production of a fully finished subassembly against an external supplier's raw component cost. The comparison must be like-for-like, or the output is noise.
Step 2: Assess strategic importance before cost
Three questions determine whether the analysis even reaches the cost stage. Is this a core competency that differentiates you in the market? Does it embed critical intellectual property? Is it tied to regulatory or compliance requirements requiring internal control? If the answer to any is yes, apply a significantly higher burden of proof to outsourcing. Capability that takes years to rebuild cannot be valued by a cost model.
Step 3: Run the full TCO comparison on both sides
Build total cost models that include every cost layer. Internal: direct labor, materials, machine time and depreciation, overhead allocation (actual, not marginal), quality and rework cost, capital investment amortized over the analysis horizon, inventory carrying cost at 15-25%, and management overhead. External: unit purchase price adjusted for volume tiers, inbound logistics and duties, incoming quality inspection, supplier management cost, transaction and ordering cost, safety stock carrying cost driven by supplier lead time variability, probability-weighted supply disruption cost, and one-time transition cost. Sensitivity-test against volume scenarios at -30%, baseline, and +30%.
Step 4: Evaluate risk and reversibility
Make risks include capacity underutilization if demand drops and fixed-cost sustainability in downturns. Buy risks include supplier concentration, geopolitical exposure, lead-time variability, and the common pricing escalation pattern where Year 1 rates understate long-term cost. The reversibility question is the one most buyers skip: once outsourced, can the internal capability be rebuilt? If not, treat the decision as effectively permanent and adjust risk weighting accordingly.
Step 5: Build the weighted decision matrix
The matrix prevents capture by any single metric, which is why consulting firms and academic frameworks consistently include it. Assign weights: total cost (30%), strategic importance (25%), quality and compliance control (20%), supply risk and resilience (15%), flexibility and scalability (10%). Score each option 1 to 5 on each dimension, multiply, and sum. The weighted scores reveal which option dominates, and the individual dimension scores reveal where trade-offs exist.
Where the framework breaks: the three hidden failure modes
Beyond the unit-price comparison trap, three additional failure modes undermine make-vs-buy decisions. Underestimating transition costs — knowledge transfer, dual running during cutover, asset write-offs — routinely adds 20% to 30% to the projected "buy" cost. Outsourcing core competencies and permanently losing critical know-how is the most expensive mistake because it is the hardest to reverse. Having no credible exit strategy means the organization is locked into the first supplier it selects regardless of performance deterioration.
Year 1 supplier pricing almost never reflects long-term cost. Suppliers price competitively to win and escalate after the relationship is locked in. A decision model that treats the introductory price as the permanent price is building on a false foundation. Trace Consultants frames this as treating make-vs-buy as a "periodic review discipline" rather than a one-time verdict — the framework should include formal triggers for re-evaluation when volumes shift, market conditions change, or a risk event exposes vulnerability.
What correct execution produces
Organizations that run make-vs-buy correctly maintain a cross-functional governance team — operations lead, finance partner, procurement specialist, engineering owner, quality lead, and the decision-maker — and the team owns the analysis, not procurement alone. Make-vs-buy that procurement runs alone is procurement that owns the blame alone when the numbers prove wrong.
They build hybrid options into every evaluation. The realistic option set for most components is not "make" or "buy" — it is a spectrum: make-to-stock plus buy-on-surge, dual sourcing at a 60/40 split, contract manufacturing with retained IP, tolling arrangements. The hybrid model is not a compromise. It is often the analytically optimal solution, combining the cost leverage of internal production with the flexibility of external capacity.
What this means in practice
- Audit your last three make-vs-buy decisions: pull the original business case and compare projected savings against actual P&L impact 12 to 24 months later. Look for the marginal-internal vs. full-external comparison error.
- For any active evaluation, mandate a full TCO comparison using the template above before any recommendation reaches leadership. Build the model with sensitivity testing at -30%, baseline, and +30% volume.
- Establish formal re-evaluation triggers and a review calendar. Decisions made in 2023 conditions may not hold in 2026. Volume shifts of ±20%, supplier market disruption, and strategic priority changes all warrant a fresh analysis.
- If you are the sole owner of the analysis, stop. Bring in operations, finance, and engineering. The framework is cross-functional by design because the costs are cross-functional by nature.
- For components where the TCO difference between make and buy is under 5%, default to the option with lower risk and higher reversibility. A marginal cost difference does not justify a hard-to-reverse commitment.
Frequently asked questions
When should we default to insourcing?
Default to "make" when the activity is a core competency, embeds critical IP, requires tight quality control that external suppliers cannot consistently match, involves high stable volumes with fixed-cost leverage, or when no reliable external supply market exists. The strategic test: would outsourcing this gradually erode a capability that makes your business competitive?
How do we account for risk in the analysis?
Two approaches: include an explicit probability-weighted risk cost line item in your TCO model (estimated disruption cost multiplied by probability of occurrence), or model explicit failure scenarios — supplier bankruptcy, plant shutdown, cyber incident, regulatory change, FX shift — and estimate impact and mitigation cost for each. For critical components, favor dual sourcing or hybrid strategies to avoid single points of failure.
What are the biggest benefits of running the framework correctly?
The framework replaces unit-price intuition with weighted strategic evaluation. Organizations that apply it catch the marginal-internal vs. full-external comparison error that produces wrong answers routinely. The discipline also surfaces hybrid options — dual sourcing, contract manufacturing, tolling — that a binary make/buy spreadsheet never considers. And it distributes accountability across functions, so the decision survives scrutiny when conditions change.
Data sources
- Supply Chain Math — Make vs Buy Framework. supplychainmath.com. Accessed July 20, 2026.
- ITER Consulting — Make vs Buy: Three Steps to a Smarter Supply Chain Strategy. iterconsulting.com. Accessed July 20, 2026.
- Trace Consultants — Make vs Buy: A Decision Framework. traceconsultants.com.au. Accessed July 20, 2026.
- Balaeva et al. — Transaction costs in public procurement (2020), Public Money & Management.
- AuraVMS — Make vs Buy Decision Procurement Analysis Framework 2026. auravms.com. Accessed July 20, 2026.