Every procurement team knows "lowest price is not lowest cost." It is the first thing taught in procurement training programs. It appears in every RFQ best-practices guide. And yet, when the spreadsheet opens and the bids arrive, the lowest unit price wins in the majority of sourcing decisions.
The gap between knowing TCO matters and actually calculating it is a persistent failure pattern across organizations. ISM research documents that TCO adoption requires a cultural shift from price thinking to total cost thinking, not just calculation tools. Without that shift, the instinct to pick the cheapest quote overrides the analysis every time.
Why the myth has a valid origin
The "lowest price wins" approach did not emerge from ignorance. It came from necessity. When procurement teams run high-volume RFQs for standardized items with tight margins, price comparison is efficient. The logic: if the specifications are identical and the suppliers are qualified, price should determine the winner.
This logic holds when two conditions are met: specifications are truly identical across all bidders, and non-price costs (quality, delivery, reliability, risk) are genuinely equivalent. In practice, these conditions are almost never met. The Spendflo RFQ process guide identifies incomplete or vague specifications as the single most common RFQ failure. When specifications are incomplete, bids are non-comparable. The buyer then defaults to price as the only clear metric — not because it is the right metric, but because it is the only metric that survived the specification gap.
The six hidden cost layers that turn cheap into expensive
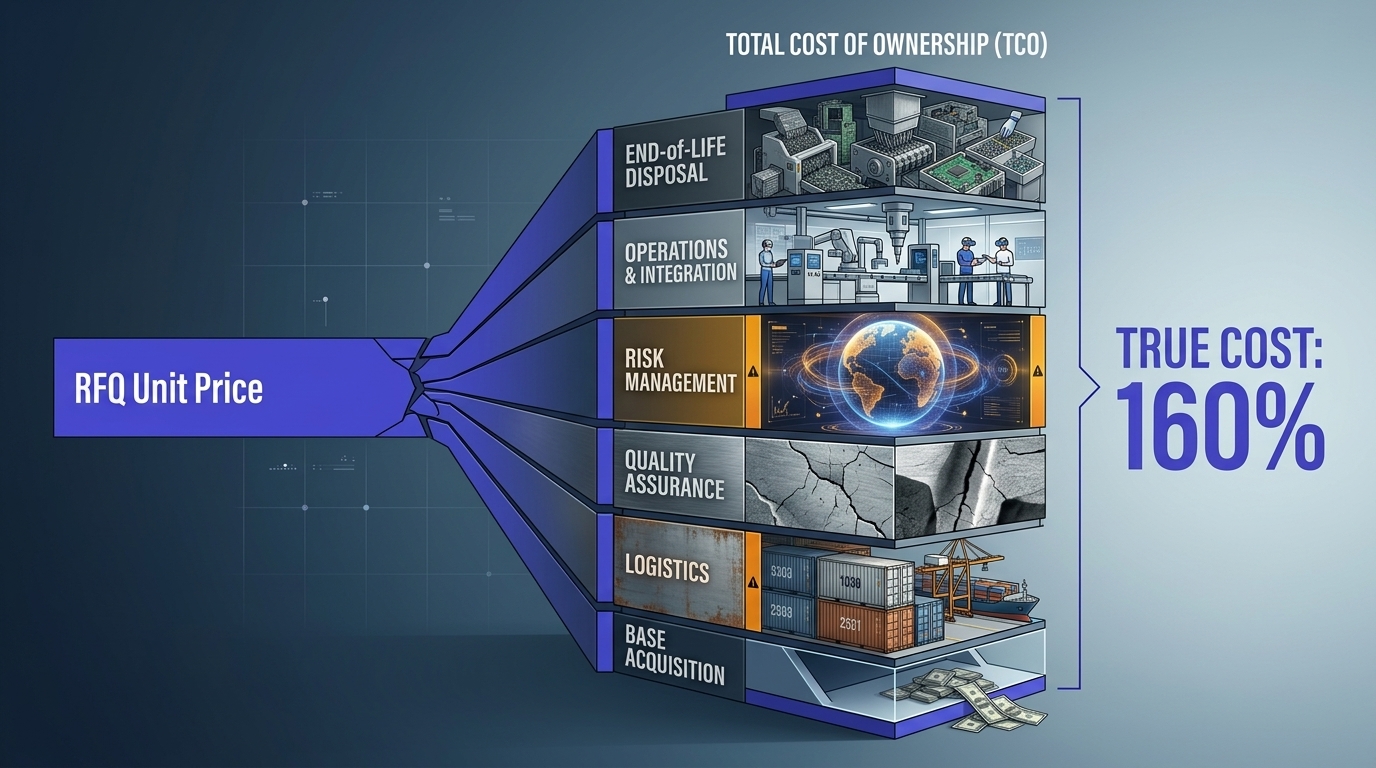
Total cost of ownership captures all costs to acquire, operate, support, and retire a purchase. The Umbrex framework on TCO in procurement identifies these as the core layers beyond purchase price. The Rzzro commodity data page provides price benchmarks for landed cost calculations:
Layer 1 — Logistics and acquisition. Freight, duties, customs brokerage, packaging, insurance, minimum order quantities, inventory carrying costs. A supplier with a lower ex-works price may have higher freight rates, longer lead times requiring more safety stock, or minimum order quantities that inflate inventory. Landed cost analysis captures this layer. Most RFQs do not require it.
Layer 2 — Quality and reliability. Inspection costs, scrap rate, rework, warranty claims, field failures, customer returns. A low-price supplier with a 5% defect rate generates higher total cost than a higher-price supplier with 0.5% defects, even before factoring in the cost of production disruptions and brand damage.
Layer 3 — Delivery and service performance. Premium freight for expedited orders, production downtime caused by late deliveries, lost sales from stockouts, extra safety stock to buffer unreliable delivery. These costs compound exponentially in just-in-time production environments. A supplier that is 5% cheaper but 15% less reliable in on-time delivery is almost certainly more expensive in total cost.
Layer 4 — Implementation and operations. Installation, training, changeover costs, process adjustments, energy consumption, consumables, maintenance frequency. For engineered components and capital equipment, these costs often exceed the purchase price over the asset's life. The sifthub RFQ procurement guide flags this as the cost category most consistently underweighted in evaluation.
Layer 5 — Risk and resilience. Supplier financial instability, single-source dependency, regulatory or compliance exposure, IP risk, supply chain disruption vulnerability. The CADDi TCO research shows that organizations using TCO in negotiations achieve double-digit savings and improve uptime by negotiating warranties, service levels, and lifecycle terms — not unit prices.
Layer 6 — End-of-life and disposal. Removal, decommissioning, environmental fees, regulatory compliance at end of life, or residual/salvage value. For categories with regulatory disposal requirements (electronics, chemicals, batteries), end-of-life costs can be material and highly variable across suppliers.
What replaces the myth: a practical TCO evaluation framework for RFQs
Replacing the lowest-price approach requires a structured evaluation framework. The steps are straightforward but require discipline to implement consistently.
Step 1: Standardize the specification before releasing the RFQ. The most common RFQ failure is incomplete specifications that generate non-comparable bids. Invest the time upfront. Witty Magazine's RFQ procurement analysis notes that time invested in specification development is recovered many times over in evaluation. A well-specified RFQ reduces supplier questions, shortens the evaluation cycle, and produces bids that can be compared on price and non-price factors alike.
Step 2: Build the landed cost baseline. Normalize every bid for differences in Incoterms, delivery terms, payment conditions, tooling costs, packaging, and minimum order quantities. The landed cost — what it actually costs to get the product to your facility — is the real starting price. Everything else is a markup that the invoice hides. Rzzro's procurement tools include cost comparison calculators for this analysis.
Step 3: Layer in lifecycle costs. For each supplier, estimate the expected cost of quality (scrap, rework, inspection), delivery performance (expediting, downtime, safety stock), implementation (training, changeover), and risk. These are estimates, not exact numbers. Even directional estimates reveal which low-price bids are actually high-cost.
Step 4: Apply weighted scoring. LightSource AI's strategic guide to RFQ evaluation recommends weighting: price 30-50%, quality 20-30%, delivery 15-25%, and supplier qualifications 10-20%, adjusted for category criticality. The weighted score determines the award, not the unit price.
What this means in practice
Audit your last five RFQ awards. For each one, calculate the landed cost and estimate the TCO differences between the winning and second-place bidder. If the lowest-price supplier won every time, your evaluation process is not working.
Build a simple TCO calculator for your top 10 categories. A spreadsheet with logistics costs, expected quality costs, and delivery performance data is better than no TCO model. The act of building the model reveals cost layers that the team was not tracking.
Change the RFQ template. Add required fields for Incoterms, warranty terms, payment conditions, tooling costs, minimum order quantities, and quality metrics. Standardized response formats make TCO comparison possible. Without them, evaluation defaults to price.
- Audit last 5 RFQ awards: did the lowest unit price win? If yes, recalculate with TCO.
- Build a landed cost plus TCO model for the top 10 categories by spend.
- Update RFQ template with required fields for all six cost layers.
- Set weighted scoring rules: price 40%, quality 25%, delivery 20%, qualifications 15%.
- Train the team on TCO calculation. One two-hour session covers 80% of the practical skills.
Why is lowest price not the same as lowest cost in procurement?
Purchase price is one layer of total cost of ownership (TCO). TCO also includes freight, duties, inventory carrying costs, quality failures, rework, scrap, downtime from late delivery, expediting fees, and end-of-life disposal. Research cited by Supply Chain Management Review shows organizations using TCO-based procurement achieve 25-30% lower total costs over three years compared to price-only sourcing.
What costs do procurement teams miss when they award RFQs by lowest unit price?
The most commonly missed costs are logistics (freight, duties, packaging), quality costs (inspection, scrap, rework, warranty claims), delivery reliability costs (expediting premium freight, production downtime, safety stock), implementation costs (training, changeover, tooling), and risk costs (supplier financial instability, compliance exposure, supply disruption). These hidden costs can add 20-60% to the apparent purchase price.
How should procurement teams evaluate RFQs to find the lowest total cost?
Build a landed cost model that includes unit price plus logistics, duties, and inventory carrying. Then add a total cost of ownership model that layers in quality, delivery reliability, implementation, and risk. Use weighted scoring where price accounts for 30-50% and non-price factors (quality, delivery, supplier qualifications) account for the rest. Normalize all bids for differences in Incoterms, warranty terms, payment conditions, and tooling costs.
Sources
- Umbrex — Total Cost of Ownership (TCO) in Procurement. Core TCO framework: acquisition, operation, support, risk, and end-of-life cost layers. Accessed June 24, 2026.
- CADDi — Total Cost of Ownership (TCO) in Procurement. Supply Chain Management Review research on 25-30% cost savings from TCO-based procurement. Intel and Samsung case references. Accessed June 24, 2026.
- ISM — Understanding Total Cost of Ownership in Procurement. TCO adoption challenges and cross-functional alignment requirements. Double-digit multi-year savings from TCO-based negotiations. Accessed June 24, 2026.
- Spendflo — RFQ Process: A Comprehensive Guide for Procurement Professionals. RFQ evaluation mistakes, TCO as key factor, weighted scoring methodology. Accessed June 24, 2026.
- Sifthub — RFQ Procurement: Process, Types & When to Use It (2026). Common RFQ mistakes: incomplete specs, price-only evaluation, vendor qualification issues. Accessed June 24, 2026.
- LightSource AI — What is RFQ in Direct Materials Procurement?. Weighted scoring: price 30-50%, quality 20-30%, delivery 15-25%, supplier qualifications 10-20%. Accessed June 24, 2026.
- Witty Magazine — Understanding RFQ in Procurement: Steps, Use Cases & Common Pitfalls. Landed cost analysis, specification development, incomplete bid normalization. Accessed June 24, 2026.