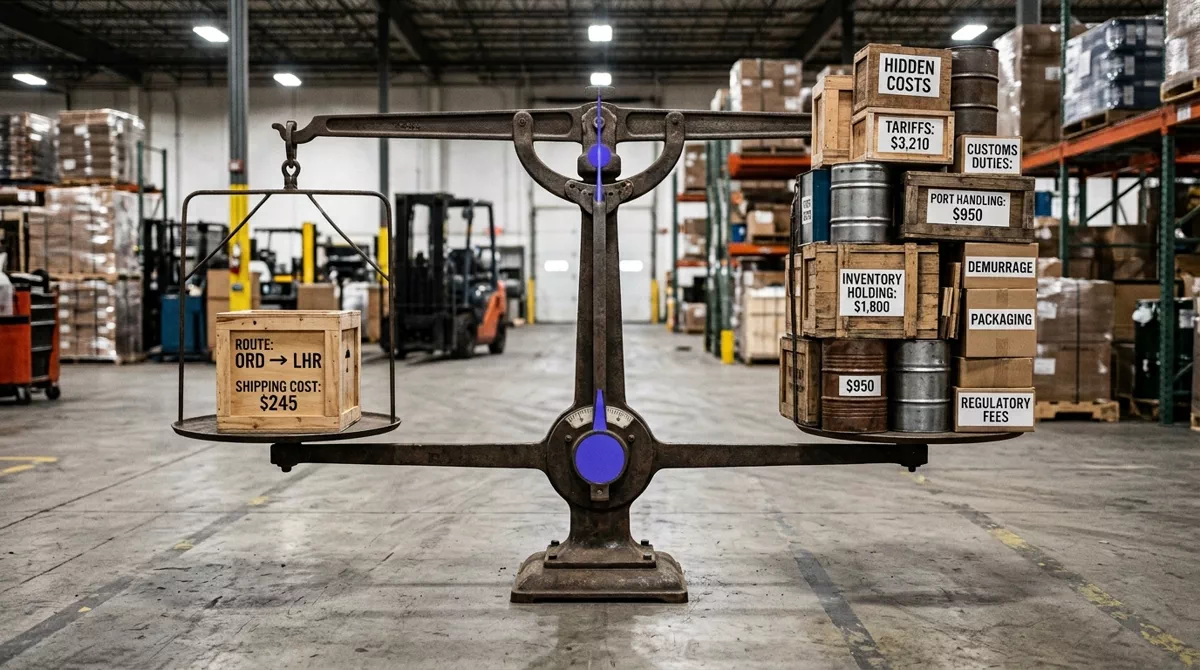
The local-versus-global sourcing decision is the most consequential judgment most procurement teams make, and most teams make it on a single number: unit price. The supplier in Shenzhen quotes $3.42 per unit. The supplier in Monterrey quotes $4.15. Decision made. Next category.
The unit price comparison is wrong often enough to matter. A real-world component comparison published in 2026 by Electrical Trader found that for an ESP32 NFC reader at 1,000 units, the China landed cost was $67.96 per unit versus $77.68 for US production. The raw unit price gap was larger. By the time freight, tariffs at 35%, customs brokerage, and the 30-40% inventory premium from global lead times were added, the gap shrank to just 12.5% — narrow enough that eliminated IP risk and faster time-to-market could close it entirely.
The variables that matter: total landed cost, not unit price
The consulting consensus across BCG, McKinsey, Deloitte, and Kearney is unambiguous: total landed cost (TLC) is the correct comparison metric. The formula is not complicated, but the inputs routinely get truncated in procurement business cases.
Total Landed Cost = Unit Price + Freight + Tariffs/Duties + Customs Brokerage + Insurance + Inventory Carrying Cost + Quality/Defect Cost + Currency Hedging + Compliance Cost.
The four hidden costs most analyses exclude: inventory carrying cost from longer supply lines adds 30-40% to working capital requirements. Tariff exposure — Section 301 at 25%+, Section 232 at approximately 50% on metals, and late-2025 China tariffs at 35% — can erase the entire unit price advantage. BCG estimates that tariffs now risk 20-30% of EBIT margins across manufacturing. Quality defects from distant suppliers create rework, line stoppages, and warranty costs that never appear in the sourcing spreadsheet. The EU Carbon Border Adjustment Mechanism (CBAM), effective from 2026, imposes direct levies on imports with high embedded emissions.
The variables that seem to matter but do not
The raw wage differential between China and Mexico is shrinking, but the differential itself was never the right variable. Kearney's 2026 Reshoring Index, while still net negative at -86, shows improvement from -115 in 2024. Most product categories now show small positive reshoring gains. The two categories dragging the index negative are Computers and Electronics and Apparel — both heavily dependent on specialized Asian manufacturing ecosystems that alternatives cannot yet replicate.
The "best cost" paradigm, as Kearney Partner Omar Troncoso describes it, is replacing the "lowest cost" paradigm. Companies are not abandoning global sourcing. They are abandoning the assumption that the lowest unit price supplier is automatically the right answer. Deloitte's 2025 Global CPO Survey, covering 250 procurement leaders across 40 countries, found that 74% now prioritize finding alternative supply sources. The unit-price-only era is ending.
BCG's global sourcing matrix: the four-quadrant framework
BCG's 2025 multidimensional global sourcing matrix provides the most operational framework published to date. It maps each procurement category on two axes: core competency (cost-driven versus innovation-driven) and resilience level (high versus low). The resulting four quadrants produce four distinct strategies, each with a different share of total procurement spend and a different sourcing geography prescription.
The matrix forces a key insight: local sourcing is not always the right answer, but neither is global. The right answer depends on where each category lands. A semiconductor component in the Premium Protection quadrant belongs with a local or nearshore supplier even at higher unit cost. A standardized fastener in the Resilient Efficiency quadrant can and should be globally sourced from diversified suppliers. Treating both categories the same way is the error the framework eliminates.
Where most teams get it wrong: the single-axis trap
The most common failure mode in local-versus-global decisions is reducing a multi-variable problem to a single variable. A team compares unit prices, finds the global supplier cheaper, and concludes global is the right answer. No TLC calculation is performed. Resilience, carbon cost, IP risk, and lead-time working-capital costs are treated as qualitative footnotes rather than quantitative inputs.
The second failure mode is more subtle: teams calculate TLC but apply it inconsistently. A category with high tariff exposure gets the full TLC treatment and shifts local. A category with lower tariff exposure gets compared on unit price alone and stays global. The inconsistency means the sourcing portfolio drifts rather than being deliberately managed. BCG's matrix prevents this by forcing every category through the same two-axis assessment.
A third failure is overcorrecting. Bain's 2024 survey found that 80% of COOs plan to increase onshoring, but only 2% have fully implemented a strategy. The risk is moving from blind globalization to blind localization — shifting categories that belong in Resilient Efficiency into Premium Protection, paying higher unit costs with no corresponding resilience gain, because the pendulum has swung too far.
What correct execution looks like
- Calculate TLC for every category above $500K annual spend. Do not skip categories because "the answer is obvious." The obvious answer is often wrong when all nine TLC inputs are quantified.
- Map each category to BCG's matrix. Innovation intensity determines the cost-versus-innovation axis. Supply market concentration and geopolitical exposure determine the resilience axis.
- Treat Premium Protection and Fragile Competitiveness as urgent. Premium Protection categories without a local supplier are exposed to innovation and quality risk. Fragile Competitiveness categories without dual sourcing are exposed to disruption risk.
- Reassess annually. Tariff regimes change. Supplier ecosystems develop. A category that belongs in Resilient Efficiency today may shift to Premium Protection if a critical supplier exits or a new tariff is imposed. The Kearney Reshoring Index tracks these shifts at the macro level; category-level reassessment is the procurement team's responsibility.
- Document the TLC assumptions. When a category stays global despite high tariff exposure, the decision file must show why. When a category shifts local despite a higher unit price, the file must show what TLC inputs flipped the decision. Institutional memory on sourcing decisions disintegrates within 18 months without documentation.
What this means for procurement teams
Take your five highest-spend categories sourced from a single region. For each, calculate TLC with all nine inputs. The result will almost certainly surprise you on at least one category — a supplier that looks like the cheapest option on unit price that is not the cheapest on total landed cost, or a local supplier whose higher unit price is justified by inventory, tariff, and quality savings that your current business case excludes.
McKinsey's benchmark data is worth repeating: top-quartile procurement maturity correlates with EBITDA margins 5 percentage points higher than laggards. The local-versus-global sourcing decision is one of the few procurement judgments that affects every cost line on the P&L simultaneously: COGS, inventory, logistics, quality, and compliance. Getting it right, with a framework instead of intuition, is worth the spreadsheet time.
Frequently asked questions
How do I decide between local and global suppliers?
Use a weighted total landed cost framework rather than comparing unit prices. Factor in freight, tariffs, inventory carrying cost (typically 30-40% higher for global sourcing), quality and defect costs, currency hedging, compliance costs, and downtime risk. The BCG Global Sourcing Matrix maps categories on two axes — need for change and ease of change — to identify which categories should shift from global to local sourcing.
When does local sourcing beat global on total cost?
Local sourcing wins on total landed cost when tariffs exceed 15-25%, when inventory carrying costs from long lead times add 30-40% to working capital, when quality defects from distant suppliers create rework and downtime costs, and when IP risk or compliance requirements (CBAM, forced labor regulations) create hidden liabilities that do not appear in unit prices.
What percentage of companies are shifting from global to local sourcing?
According to Bain's 2024 Operations Executive Survey, 80% of COOs plan to increase onshoring or nearshoring in the next three years, up from 63% in 2022. However, only 2% have fully implemented a nearshoring or onshoring strategy. McKinsey's 2025 Supply Chain Risk Pulse found 33% of supply chain leaders actively developing nearshoring plans.
What is the total landed cost formula for comparing suppliers?
Total Landed Cost = Unit Price + Freight + Tariffs and Duties + Customs Brokerage + Insurance + Inventory Carrying Cost + Quality and Defect Cost + Currency Hedging + Compliance Cost. Global sourcing adds 30-40% to inventory costs through safety stock requirements. For tariff-affected categories, the landed cost gap between global and local narrows significantly.
Data sources
- BCG — Acting Decisively as Global Sourcing Shifts (2025)
- BCG — Cost and Resilience: The New Supply Chain Challenge (2025)
- Bain — Nearshoring: Overcoming the Obstacles (2024)
- Kearney — 2026 Reshoring Index
- McKinsey — Supply Chain Risk Pulse (2025)
- Deloitte — 2025 Global CPO Survey
- Electrical Trader — Global vs. Local Sourcing Cost Comparison (2026)
- McKinsey — Where Procurement Is Going Next (2024)