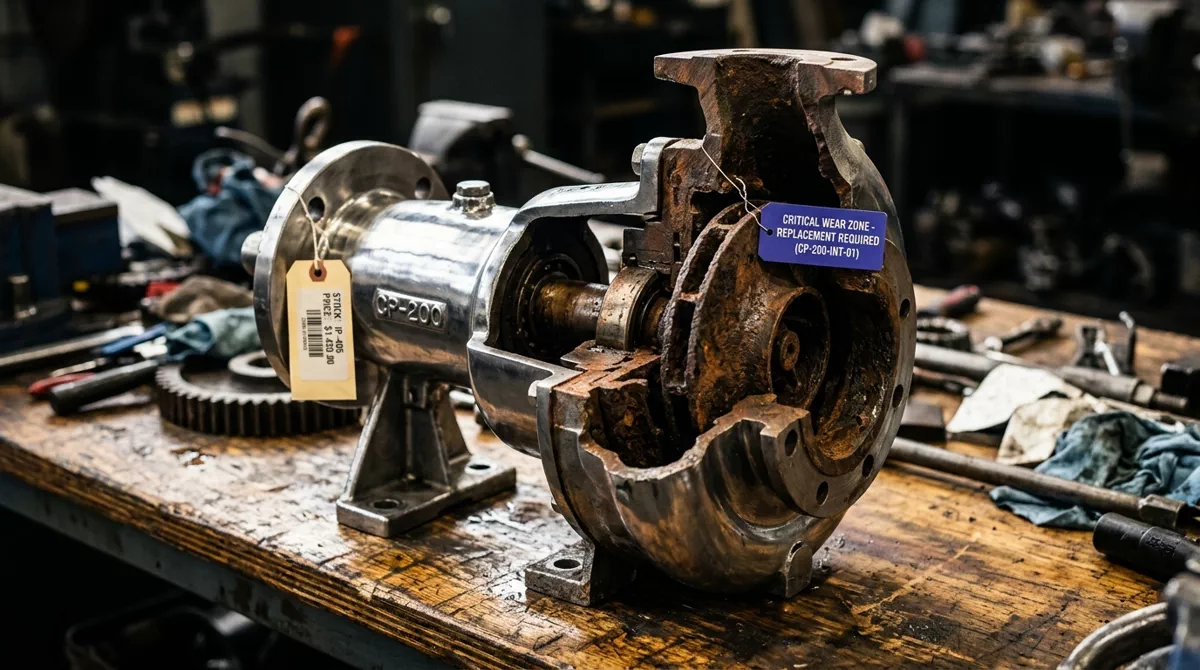
Every procurement team has been told to calculate total cost of ownership. Most still do not — at least not in a way that changes which supplier wins. The disconnect is not conceptual. It is operational. Teams lack a repeatable method for surfacing the hidden cost categories that live in maintenance departments, on factory floors, and in energy bills that never cross the procurement desk.
Research consistently shows that purchase price captures only 40 to 60 percent of an asset's total lifetime cost. The remaining 40 to 60 percent is spread across maintenance, energy consumption, operator training, downtime, spare parts, integration, and disposal. This article provides the step-by-step framework for identifying those hidden categories and converting them into negotiation levers and contract terms.
Step 1: Build the lifecycle cost taxonomy for your asset category
Before any supplier conversation, build the cost taxonomy. This is the single step most teams skip — and the reason their TCO models are incomplete. The taxonomy must be specific to the asset category. A pump has different hidden costs than a fleet vehicle, which has different hidden costs than IT hardware.
Start with this universal taxonomy and customize it:
The cost categories that change the winning supplier are almost never the ones the procurement team discussed in the first supplier meeting. They are the ones the maintenance manager, the plant engineer, and the energy manager know about — and nobody asked them.
Step 2: Gather cost data from the departments that own it
The hidden lifecycle costs do not live in the ERP. They live in maintenance logs, energy bills, training records, and production downtime reports. This step is not a desk exercise. It requires walking to the maintenance office, the plant floor, and the energy manager's desk.
For each cost category in the taxonomy, identify the data owner and the data source. Maintenance cost data typically lives in the CMMS (computerized maintenance management system). Energy consumption data comes from utility bills and submeters. Downtime cost requires production throughput data from operations. Operator training cost requires HR records.
The most common failure at this step: accepting estimates instead of data. A maintenance manager who says "about $2,000 per quarter" is estimating. The CMMS report showing $2,847.30 in Q1 and $3,102.15 in Q2 is data. The difference between the two is the gap this framework closes.
Step 3: Convert hidden costs into supplier evaluation criteria
This is where the framework moves from analysis to action. Each hidden cost category maps to a specific supplier evaluation criterion. The mapping is not one-to-one — one hidden cost may produce multiple evaluation criteria across different suppliers.
Energy consumption per operating hour becomes an evaluation criterion weighted at 15 percent of the total score if energy is a significant cost driver. Mean time between failures becomes a criterion weighted at 20 percent if downtime cost is high. Training hours required becomes a criterion weighted at 5 to 10 percent depending on operator specialization.
The weighting must be transparent and documented. Every supplier sees the same criteria and the same weights. This is what separates a rigorous TCO evaluation from a post-hoc justification for the supplier the buyer already preferred.
Step 4: Map hidden cost categories to contract terms
Identifying hidden costs is analysis. Converting them into contract terms is negotiation. The framework produces specific contract clauses for each significant cost category:
Specific clause mappings from the taxonomy: maintenance cost maps to extended warranty coverage and preventive service contracts. Energy cost maps to efficiency specifications with guaranteed maximum consumption. Downtime cost maps to uptime guarantees with financial penalties per hour of unplanned downtime exceeding the target. Operator cost maps to bundled training packages included in the purchase price. Disposal cost maps to take-back clauses and residual value guarantees.
Step 5: Build the TCO comparison model and run sensitivity analysis
The final step is building the comparison model. This is a spreadsheet, not a software purchase. It calculates total cost over the asset's expected service life for each supplier being evaluated. The model has five columns: cost category, Supplier A, Supplier B, Supplier C, and the cost driver assumption.
The cost driver assumption is the critical column that most teams omit. If energy cost assumes $0.12 per kWh and 2,000 operating hours per year, changing either assumption should recalculate the entire model. Sensitivity analysis is not optional — it answers the question "which supplier wins if energy prices rise 30 percent?" and "which supplier wins if the asset runs for 12 years instead of 8?"
Gartner's procurement research confirms that long-term ownership costs and maintenance costs are routinely underestimated. The sensitivity analysis is the antidote to this systematic underestimation. If Supplier A wins at the base case but Supplier B wins under three of five sensitivity scenarios, the CPO has a data-backed reason to choose Supplier B — or to negotiate specific guarantees from Supplier A.
The most common failure mode: stopping at acquisition cost
The specific way this framework fails in practice: a category manager builds the TCO model, presents it internally, and the finance team asks why the purchase price is higher than the incumbent. The category manager cannot explain the lifecycle trade-off in 90 seconds. Finance overrides the TCO analysis with a purchase-price comparison. The supplier with the lowest sticker price wins. The organization pays the hidden costs later, in a different budget, and nobody connects the two.
Preventing this failure requires two things. First, the TCO model must produce a single number per supplier — total cost over asset life — that can be compared directly. Second, the CPO must pre-brief finance on the methodology before the supplier evaluation begins. If finance only sees the purchase price column, they will optimize for purchase price. The briefing is a 15-minute meeting that prevents a decision that costs the organization 40 to 60 percent more over the asset's life.
What this means in practice
- Build the taxonomy before the RFQ. Customize the eight-category framework above to your asset. Identify the data owner and data source for each category. Complete this step before any supplier conversation.
- Walk the floor to get real data. Maintenance logs, energy bills, and production downtime reports contain the numbers. Estimates from department heads do not. The difference between the two determines whether the TCO model changes the outcome.
- Convert every hidden cost to a contract clause. Energy consumption becomes an efficiency guarantee. Downtime becomes an uptime SLA with penalties. Training becomes a bundled service. If a cost category has no contract clause, the supplier has no incentive to minimize it.
- Run sensitivity analysis before presenting results. Change the energy price. Extend the service life. Increase the operating hours. If the winning supplier changes under reasonable scenarios, flag it in your recommendation.
- Brief finance before they see the purchase price. A 15-minute meeting that explains the TCO methodology prevents finance from optimizing the wrong number.
Frequently asked questions
How much of an asset's total cost does the purchase price typically represent?
Studies consistently show that purchase price captures 40 to 60 percent of total asset lifetime cost for industrial equipment, vehicles, and machinery. The remaining 40 to 60 percent is spread across maintenance, energy consumption, training, downtime, spare parts, integration, and disposal — costs that most procurement teams never systematically quantify.
What are the most commonly overlooked lifecycle cost categories?
The top five: (1) preventive and corrective maintenance over the asset's service life, (2) energy or fuel consumption, (3) operator training and certification, (4) unplanned downtime cost during repairs, and (5) end-of-life decommissioning and disposal. Integration costs — connecting the new asset to existing systems — are also consistently underestimated.
How do I convert hidden lifecycle costs into negotiation levers?
Map each hidden cost category to a specific contract clause. Extended warranty coverage addresses maintenance risk. Uptime guarantees with financial penalties address downtime cost. Bundled training packages address operator readiness. Energy efficiency specifications address consumption cost. The framework in this article provides the full mapping.
Is TCO analysis worth the effort for indirect spend categories?
For high-value indirect categories like IT hardware, facility equipment, and fleet vehicles, TCO analysis typically identifies 15 to 25 percent in avoidable lifecycle costs. For low-value, transactional indirect spend, the analysis cost may exceed the savings. Apply the framework to categories where the asset value exceeds $50,000 or the expected service life exceeds three years.
Sources
- Gartner — Procurement and Supply Chain Research 2026. TCO underestimation patterns in industrial procurement. Long-term ownership cost data.
- Deloitte — 2025 Global CPO Survey. Cost reduction as the dominant CPO priority and the gap between cost focus and total value delivery.
- The Hackett Group — 2026 Key Issues Study. Procurement workload trends and the structural pressure to cut corners on supplier evaluation.
- McKinsey — Procurement and Supplier Management. Data on procurement operating model benchmarks and analytics capability gaps.
- Ivalua — Procurement Analytics Research 2026. Spend analytics accuracy and the cost of misclassified procurement data.