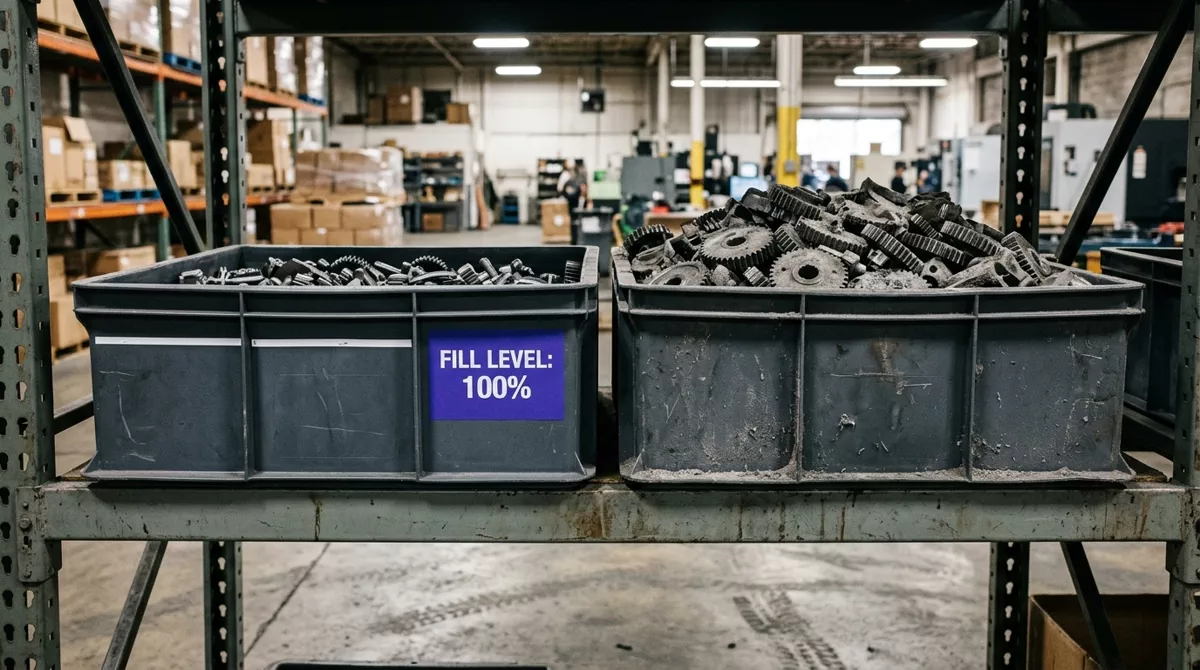
A buyer for an electronics manufacturer places a quarterly order for 5,000 connector units. The supplier's minimum order quantity (MOQ) is 5,000. The unit price is $2.80 — a 15% discount from the standard $3.30 for smaller volumes. The order arrives. Six months later, 1,200 units sit in a warehouse rack, obsolete because the engineering team switched to a different connector spec in the next design cycle. The total cost: $3,360 in dead stock plus $840 in warehousing — erasing the entire purchase discount.
The buyer treated MOQ as if it were an optimal order quantity. It was not. Economic Order Quantity (EOQ) and Minimum Order Quantity are fundamentally different concepts that answer different questions. Procurement teams that use them interchangeably — or worse, assume the supplier's MOQ is close enough to their EOQ — systematically over-order, over-stock, and erode working capital.
EOQ defined: the buyer's optimization
Economic Order Quantity is a buyer-side calculation that determines the order size minimizing total inventory cost. The classical formula — EOQ = √(2DS/H), where D is annual demand, S is ordering cost per order, and H is holding cost per unit per year — balances two opposing forces. Larger orders reduce ordering cost (fewer purchase orders, less receiving labor) but increase holding cost (more capital tied up, more warehousing). Smaller orders do the reverse. EOQ finds the point where the two cost curves intersect.
The formula was developed in 1913 by Ford Whitman Harris and carries assumptions that procurement professionals should know cold: demand is stable, replenishment is instantaneous, no quantity discounts exist, and no stockouts occur. A 2024 academic review published in Sustainability found the classical EOQ "rarely applicable in practice without modification" because these assumptions break under real supply chain conditions — variable lead times, minimum order constraints, and quantity-dependent pricing that the basic formula cannot model.
What EOQ is not: a forecast, a budget, or a contractual term. It is a directional calculation. It tells you the economically efficient order size — not what the supplier will accept, not what your warehouse can hold, and not what your cash position can fund.
MOQ defined: the supplier's constraint
Minimum Order Quantity is a supplier-side constraint. It reflects the smallest batch the supplier can economically produce or ship, driven by setup costs, production run minimums, raw material minimum purchase obligations, and margin requirements. A chemical manufacturer may require a minimum production run because cleaning reactors between batches costs $15,000 — producing 100 liters or 10,000 liters costs the same in changeover. The MOQ is the volume at which the gross margin on the order covers that setup cost.
Suppliers set MOQs to protect their economics, not the buyer's. A supplier with 45% gross margin can afford a lower MOQ than one at 22%. A supplier running at 90% capacity utilization sets higher MOQs to filter out small, low-margin orders. None of these variables have anything to do with the buyer's optimal inventory level.
MOQ is a negotiation variable. Suppliers will reduce MOQs when buyers offer something in return: longer commitment, higher annual volume, consolidated SKUs, or modified payment terms. The MOQ on the first quote is rarely the supplier's true floor — it is their opening position.
MOQ is 5,000 units. You order 5,000 units. EOQ would have been 1,800. Excess inventory of 3,200 units costs $5,120 in annual carrying cost at 20% of unit price — consuming the 15% volume discount and then some.
Calculate the full lifecycle cost of accepting MOQ. The 15% discount saves $2,500. Excess carrying cost is $5,120. Net loss: $2,620. Either negotiate the MOQ down or accept that this supplier's economics do not fit your demand profile.
When the distinction matters most: the three scenarios where conflating them breaks
Slow-moving items with irregular demand. A maintenance part with annual demand of 60 units and an MOQ of 100 will sit in inventory for 20 months. The carrying cost over that period — cost of capital at 8-12%, storage, insurance, obsolescence — often exceeds 30% of the item's value. The supplier's bulk discount of 10-15% does not cover it.
Custom or engineered components. Specifications change. An MOQ of 500 on a custom connector may leave 200 units obsolete when the next design revision ships. The unit price discount amortizes across used units only — not the full order. If the effective price on the 300 actually-used units is $4.67 instead of the quoted $2.80, the "discount" was a premium in disguise.
Cash-constrained periods. When working capital is tight — end of quarter, large capital expenditure cycles — accepting an MOQ above EOQ means choosing inventory over liquidity. A $50,000 order at MOQ when EOQ would be $18,000 ties up $32,000 that cannot fund supplier early-payment discounts, raw material spot buys, or other higher-return uses of cash.
What correct execution looks like
Organizations that manage EOQ and MOQ correctly evaluate them as two variables in an integrated inventory policy — not one decision. The workflow: calculate EOQ independently. Compare to supplier MOQ. If EOQ ≥ MOQ, order at EOQ. If MOQ > EOQ, model the gap: what is the carrying cost of the excess units over their full holding period? Does the volume discount cover it? If yes, order at MOQ and document the trade-off. If no, negotiate the MOQ or find an alternative supplier whose production economics better align with your demand profile.
Inventory policies — EOQ, MOQ, safety stock, reorder points — are designed as one integrated system, not three independent formulas. A change to safety stock (because lead times lengthened) affects the effective EOQ (because holding cost of safety stock changes total inventory cost). Tuning them independently produces a false sense of optimization — each number looks right individually but produces the wrong outcome together.
What this means in practice
- Calculate EOQ for your top 20 SKUs by annual spend. Use your actual ordering cost (purchasing labor, receiving, inspection per order) and holding cost (cost of capital, warehouse, insurance, obsolescence as a percentage of unit value). Compare to current order quantities. Flag every SKU where the gap exceeds 25%.
- Negotiate MOQs on SKUs where the gap is largest. The supplier will reduce MOQ if you offer consolidated ordering across SKUs, extended commitment, or net-30 instead of net-60 terms. The negotiation is about supplier economics — understand their setup cost and margin structure to make a credible counter-proposal.
- Model the full lifecycle cost before accepting any MOQ above EOQ. The calculation is: total carrying cost = (MOQ − EOQ) × unit cost × annual holding cost rate × (MOQ / annual demand in years). If this exceeds the volume discount, the larger order costs money.
- Segregate custom and standard SKUs. Custom parts with evolving specifications carry higher obsolescence risk — cap MOQ-to-EOQ ratio at 1.2x for these items even if the volume discount looks attractive on paper.
Frequently asked questions
Does EOQ work when demand is seasonal?
The classical EOQ assumes stable demand. For seasonal items, use a period-specific EOQ — calculate separately for peak and off-peak demand periods, or use dynamic lot-sizing methods that optimize across multiple periods rather than assuming uniform demand.
What is a reasonable annual holding cost rate?
Industry benchmarks range from 18-30% of item value. Cost of capital is typically 8-12%. Warehouse space, labor, and equipment add 4-8%. Insurance and taxes add 2-4%. Obsolescence and shrinkage vary by category — 2-5% for standard components, 8-15% for custom or technology items. Use the higher end for electronics and custom parts.
Can MOQ be zero?
Effectively yes — if the supplier's production process has negligible setup cost and they are willing to ship single units. This is uncommon in manufacturing but increasingly common in digital goods, 3D-printed components, and some service contracts. In these cases, EOQ governs alone and you order exactly to demand.
Sources
- MDPI Sustainability — EOQ: A State-of-the-Art in the Era of Uncertain Supply Chains (2024). Accessed July 11, 2026.
- EazyStock — Overcoming Minimum Order Quantity Challenges. Accessed July 11, 2026.
- NetSuite — Minimum Order Quantity Guide. Accessed July 11, 2026.
- Shipfusion — MOQ Explained. Accessed July 11, 2026.
- Finale Inventory — MOQ Guide. Accessed July 11, 2026.