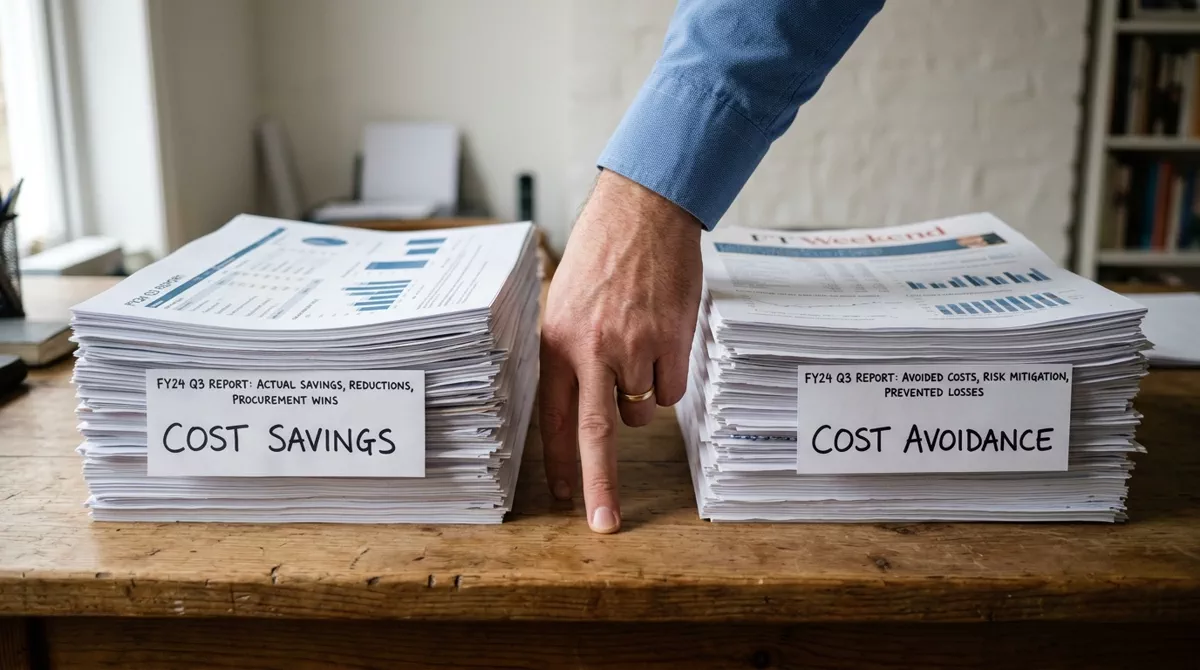
A procurement director presents quarterly savings of $4.2 million to the CFO. The CFO looks at the P&L and sees $2.1 million. The gap is not fraud. It is two different metrics being called by the same name. Procurement reports cost reduction and cost avoidance as one number. Finance only counts what hits the ledger. Every quarter, the same meeting happens in organizations that have not separated the two.
The distinction is the single most argued issue in procurement measurement. Sievo calls it "the most argued issue when talking about procurement savings." The Institute for Supply Management's Mark Crowder frames it directly: "Cost avoidance will likely not be recognized as savings. Neither will contract-negotiation savings. The invoices and financial reports will tell the tale." This is not a measurement nuance. It determines whether procurement is trusted as a strategic function or tolerated as a cost center.
The precise definitions
Cost reduction — also called hard savings — is an actual, measurable decrease in current-period expenditure against an agreed, verifiable baseline: prior year actuals, the current contracted price, or an approved budget. The formula is straightforward: (old unit price minus new unit price) multiplied by actual volume. The old price is a historical recorded figure — last year's invoice, the previous contract rate, a line item in the approved budget. The reduction appears on the P&L as lower OPEX or COGS. Finance can trace it to a general ledger account. It is auditable. It improves EBITDA in the current fiscal year.
Cost avoidance — also called soft savings — is an expenditure that would reasonably have been incurred in a forecast period absent procurement intervention, based on documented, accepted counterfactuals. The formula: (counterfactual cost minus actual negotiated cost) multiplied by volume over a defined horizon. The counterfactual is a supplier-proposed increase, a market index projection, or a forecast baseline. The avoidance does not appear on statutory financial statements. It is tracked off-ledger in procurement performance dashboards. Finance views it as subjective because it cannot be audited on the GL.
What procurement often reports
"$4.2M in savings this quarter." But $2.1M of that is cost avoidance — price increases that were prevented, not costs that were reduced. Finance cannot see $2.1M of it on the P&L. The credibility gap opens.
What procurement should report
"$2.1M in hard savings (P&L-verified) and $2.1M in cost avoidance (price increases prevented)." Finance sees the $2.1M on the ledger. The $2.1M avoidance is tracked as a separate value-contribution metric. Both numbers are real. Neither is inflated.
The measurement gap: how much savings actually leak
Suplari's research on procurement savings maturity identifies four stages: negotiated, implemented, realized, and validated. The leakage at each stage is substantial. Between negotiation and implementation, 30% to 40% of identified savings fail to materialize — contracts are signed but maverick buying, specification changes, and volume shifts erode the captured value. Between implementation and realization, another 15% to 20% gap opens as invoice-to-contract discrepancies accumulate. Only organizations that track through all four stages deliver 75% to 85% of identified potential — meaning even world-class procurement loses 15% to 25% of what was negotiated.
CAPS Research, via the Institute for Supply Management, benchmarked procurement savings across industries: hard savings average 3.1% of managed spend (range: 2.2% for utilities to 5.3% for financial services), while cost avoidance averages 2.0%. These are self-reported benchmarks. Given the Suplari data on leakage, many organizations are reporting the negotiated number rather than the realized number, which inflates both figures.
Why the distinction determines procurement's credibility
When procurement blends hard savings and avoidance into a single number and presents it to finance, three things happen. First, finance rejects the number because it cannot reconcile it with the P&L, and the rejection is usually quiet — the CFO simply stops using procurement's data for budgeting and planning. Second, procurement loses the ability to argue for resources: a function whose numbers are not trusted cannot justify headcount, technology investment, or strategic initiatives. Third, the incentives break: if procurement bonuses are tied to "total savings" without separating reduction from avoidance, procurement is rewarded for claiming unverifiable savings — which it does, and finance knows it does.
What correct measurement looks like
Arkestro and Commercial Consulting converge on the same recommendations. Track hard savings and cost avoidance on separate KPI lines. Never combine them. Establish baselines before initiatives begin, with finance involved in baseline validation from the start. Use the four-stage tracking framework — negotiated, implemented, realized, validated — and measure procurement performance at the realized stage, not the negotiated stage. For cost avoidance specifically: agree on counterfactual methodology with finance upfront, document the alternative scenario that would have materialized without procurement action, and never present avoidance as having P&L impact in finance reporting.
AI-based invoice-to-contract reconciliation is becoming the standard for closing the realized-to-validated gap. McKinsey found one pharmaceutical company uncovered more than $10 million in contract-invoice discrepancies using automated reconciliation — discrepancies that periodic spreadsheet reviews had missed for years. The technology replaces the quarterly manual reconciliation that allows leakage to accumulate silently.
What this means in practice
- Pull your last three quarterly savings reports. Count how many line items use a verifiable historical baseline and how many use a counterfactual. If the blend is unclear, your finance team already knows and has stopped trusting the numbers.
- Establish a joint finance-procurement governance process for baseline validation. The baseline must be agreed before the initiative launches — not negotiated after the results are reported.
- Split your savings dashboard into two KPI lines: cost reduction (P&L-verifiable) and cost avoidance (counterfactual-based). Report them separately inside the organization and to leadership.
- Track savings through the four stages. If you are currently measuring at the negotiated stage (most organizations are), the realized number is 30-40% lower. Start tracking at the realized stage and close the gap.
Frequently asked questions
Is cost avoidance real money?
It is real in the sense of economic value protected — preventing a $100K price increase is as commercially valuable as reducing an existing cost by $100K. It is not real in the accounting sense: it does not appear on invoices, cannot be tied to a GL account, and does not free up budget for reallocation. The value is real but the measurement is subjective, which is why it belongs on a separate KPI line from hard savings.
Why does the 30-40% leakage happen between negotiation and realization?
Three mechanisms. Maverick buying: users order from non-contracted suppliers even after a favorable contract is signed. Volume drift: actual purchase volumes differ from the volumes assumed in negotiation, changing the realized savings. Specification changes: the item being purchased changes after the contract is signed, invalidating the negotiated price comparison. Each mechanism is preventable with contract compliance monitoring and post-contract governance.
What if finance refuses to recognize cost avoidance at all?
That is the correct starting position for statutory financial reporting — cost avoidance does not belong in the audited financial statements. Reserve cost avoidance for procurement performance reports, value-contribution dashboards, and strategic narratives. Use it to demonstrate that procurement prevented cost increases, not that procurement lowered the cost base. Sievo recommends: focus hard savings for finance stakeholders, include avoidance in broader stakeholder reporting on procurement's total value contribution.
Data sources
- Sievo — Procurement savings: a comprehensive guide. sievo.com. Accessed July 20, 2026.
- Suplari — Cost avoidance vs cost savings: why both matter. suplari.com. Accessed July 20, 2026.
- ISM — The monthly metric: procurement savings. ismworld.org. Accessed July 20, 2026.
- Arkestro — Cost avoidance vs hard savings: how CFOs actually measure procurement value. arkestro.com. Accessed July 20, 2026.
- Tacto — Procurement glossary: cost avoidance. tacto.ai. Accessed July 20, 2026.