Tail Spend Management: The Hidden $50 Million Opportunity in Every Enterprise
The average enterprise leaks 8-12% of total spend through tail categories. Here is the data on where it goes, why it stays hidden, and how leading procurement teams are capturing it.
The Scope of the Problem
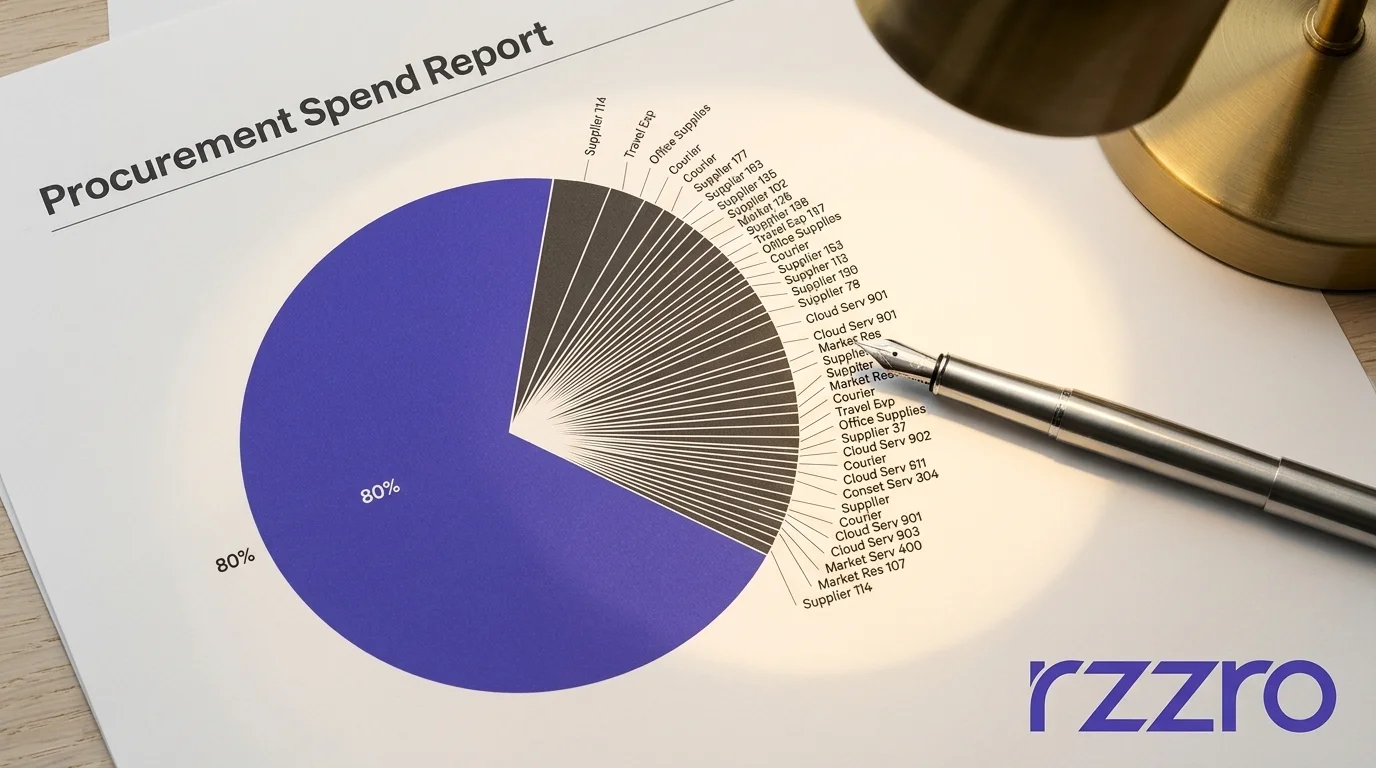
In a typical $1 billion enterprise procurement operation, roughly $800 million flows through strategic sourcing categories managed by dedicated category managers. The remaining $200 million — tail spend — passes through thousands of one-off transactions, non-contract purchases, emergency buys, and departmental direct orders that no procurement professional ever touches.
The Hackett Group's 2025 procurement benchmarks place the average tail spend share at 21% of total addressable spend across industries. In manufacturing and healthcare, the figure rises to 32% due to the volume of MRO (maintenance, repair, and operations) purchases and specialized clinical supplies.
McKinsey's 2025 procurement cost analysis found that companies in the top quartile of procurement maturity manage tail spend at 6-8% of total addressable spend. Bottom-quartile organizations have tail spend shares between 28% and 40%.
The gap between top and bottom performers represents more than just process inefficiency. It represents millions in margin that CPOs cannot defend, optimize, or even measure.
Why Tail Spend Persists
Tail spend is not an oversight. It is a structural feature of how enterprises buy. Four dynamics create and entrench it:
- Supplier fragmentation. A $5 billion manufacturer may have 30,000 suppliers on file, of which 25,000 account for under $50,000 in annual spend each. Each relationship carries fixed administrative costs that exceed the value of the relationship. Yet those suppliers exist because someone in the organization needed something specific — and no central contract existed.
- Data classification gaps. Most ERP systems classify spend at the GL account level, not at the category level. An engineering department buying a one-off software license classifies it as "IT Services." The same category code captures a $5 million cloud contract. The tail transactions vanish into the same bucket as strategic spend, making them invisible to traditional analytics.
- Maverick buying as default behavior. Gartner's 2025 procurement survey found that 42% of tail spend originates outside procurement channels entirely — employees using corporate cards, direct vendor relationships, or one-time payment requests. When the procurement process adds 3-5 days to a $500 purchase, business units bypass it. They are not wrong to do so from their perspective; the friction is the problem.
- High transaction cost. The cost to process a single purchase order runs between $50 and $150 depending on the organization's automation level.
The Real Cost of Unmanaged Tail
The savings leakage from unmanaged tail spend operates on three levels:
Direct Price Premium
Non-contract purchases carry a 12-25% price premium compared to contracted equivalents. Without volume commitments, competitive bids, or negotiated pricing, spot purchases default to list prices. For a $200 million tail spend pool, this premium alone represents $24-50 million in annual overpayment.
Process Inefficiency
Each tail transaction that requires manual intervention — three-way matching, exception handling, PO approval routing — costs 5-10x more to process than an automated transaction in a contracted category. When 40-60% of all procurement transactions run through tail channels, these inefficiencies compound into hundreds of thousands of hours of administrative labor.
Foregone Leverage
Every dollar that flows outside procurement channels represents a dollar that cannot be aggregated into a negotiation. A $50 million tail spend pool, if consolidated, would give the organization genuine leverage in categories where it currently has none. The loss is not just the price premium. It is the ability to set terms.
Segmenting the Tail
Not all tail spend deserves the same treatment. The most effective programs segment the tail into three bands based on strategic potential:
- The Manageable Tail (top 5% of tail suppliers, 40-50% of tail spend). These are high-value, recurring purchases that simply fell outside the strategic sourcing radar. A department buying $200,000 annually in specialized lab equipment or a quarterly consulting retainer with a single vendor. These are prime candidates for formal contracts, competitive bidding, and category assignment. Target: 10-15% savings within 12 months.
- The Optimizable Tail (next 15% of suppliers, 25-30% of tail spend). Semi-recurring purchases with moderate value density. Think maintenance contracts, training services, and event-related spend. These benefit from preferred supplier programs, guided buying, and procurement card category controls. Target: 5-8% savings through channel optimization.
- The Transactional Tail (remaining 80% of suppliers, 15-25% of tail spend). True low-value, low-frequency purchases. The one-off software license, the emergency part, the office supply run. These do not justify individual sourcing events. Automation, procurement cards with automatic receipt matching, and marketplace-style purchasing are the right tools. Target: Reduce transaction cost by 40-60%.
This segmentation avoids the trap of over-investing in low-value relationships while leaving valuable consolidation opportunities on the table. The 80/20 rule here has a corollary: 5% of tail suppliers represent nearly half the tail value.
The Tail Capture Playbook
The organizations that consistently outperform on tail spend follow a repeating four-phase cycle: visibility, rationalization, channelization, and monitoring.
Phase 1: Visibility
No tail management program succeeds without a clean data foundation. The first step is to extract every transaction from every source — ERP, P-card, invoice, expense report, direct pay — and classify each one into a consistent category taxonomy. The Hackett Group benchmarks show that 62% of enterprises cannot accurately classify more than half their tail spend within a single fiscal quarter.
Tools that use AI-driven spend classification have reduced the time to achieve 90%+ classification accuracy from six months to three weeks at early-adopter enterprises. The difference between running a tail program and merely talking about one is this classification layer.
Phase 2: Rationalization
Once you see the spend, you can rationalize it. This means supplier consolidation (reduce the tail supplier base by 30-50% over 18 months), contract migration (move high-value tail to existing strategic contracts where possible), and pricing alignment (leverage the aggregate spend volume across tail categories to negotiate preferred pricing).
A Fortune 500 industrial company consolidated 14,000 tail suppliers to 7,200 over 24 months and reduced tail spend by 18% — $34 million annually — with no disruption to operations. The majority of savings came from shifting maverick purchases to existing strategic contracts that already had negotiated pricing.
Phase 3: Channelization
Channelization means creating the path of least resistance through procurement. If the approved process is faster and easier than the maverick route, employees will use it. Leading programs deploy three mechanisms:
- Guided buying portals that surface pre-approved catalogs with negotiated pricing before an employee can submit a free-text requisition
- Virtual P-card controls that block non-compliant merchant categories and flag out-of-pattern purchases in real time
- Marketplace integrations (Amazon Business, Grainger, Fastenal, etc.) for MRO and indirect categories, where contracted pricing feeds directly into the procurement system
Phase 4: Monitoring
Tail spend re-emerges continuously. New suppliers appear, old contracts expire, and business needs shift. A monitoring cadence — quarterly supplier onboarding audits, monthly tail spend dashboards, and real-time maverick spend alerts — keeps the tail contained.
Technology Stack for Tail Management
The technology stack for tail spend management has matured significantly. The core components are:
Building the Business Case
For a mid-market enterprise with $500 million in total procurement spend, the tail share is approximately $105 million at the 21% benchmark rate. A well-executed tail management program typically delivers:
The program investment includes technology (spend classification, P2P automation, guided buying portal), headcount (one dedicated tail spend analyst per $300M in managed spend), and implementation services. Total first-year cost typically runs $400,000 to $800,000 for a mid-market deployment.
The payback period of 12-18 months makes tail spend management one of the fastest-returning procurement initiatives available. For comparison, a full Source-to-Pay implementation takes 18-24 months to reach net positive ROI.
The organizations that capture this opportunity share one characteristic: they treat tail spend as a portfolio to be managed, not a problem to be solved. The difference determines whether the savings compound year over year or leak back into the organization.
Frequently Asked Questions
What is the difference between tail spend and maverick spend?
Tail spend is any non-strategic, low-value procurement spend, regardless of whether it follows procurement policy. Maverick spend is a subset of tail spend that specifically bypasses approved procurement channels. Not all tail spend is maverick; some tail spend flows through correct channels but at low volumes that do not justify strategic sourcing.
Can AI fully automate tail spend management?
AI can automate spend classification, maverick detection, and guided buying recommendations. However, supplier rationalization, contract negotiation, and category strategy remain human-led activities. The most effective programs apply AI to the visibility and monitoring phases, and human judgment to the rationalization and supplier relationship work.
How do you get business units to stop buying outside procurement?
The most effective approach is not policy enforcement — it is friction reduction. When the procurement channel is faster, easier, and offers comparable or better selection, business units self-correct. Leading organizations measure "time to purchase" for tail categories and target sub-24-hour cycle times through catalog-guided buying and procurement cards with automated reconciliation.
What industries benefit most from tail spend programs?
Manufacturing, healthcare, and financial services consistently show the largest tail spend savings potential due to high MRO volumes, specialized clinical supply chains, and fragmented professional services spend. However, any organization with over $200 million in procurement spend has a meaningful opportunity — the economics scale linearly with total spend.
Sources and References
- The Hackett Group, "2025 Procurement Performance Benchmarks," 2025. thehackettgroup.com
- McKinsey & Company, "Procurement 2030: The Next Decade of Value Creation," Operations Practice, 2025. mckinsey.com
- Gartner, "Procurement Technology and Spend Management," 2025. gartner.com
- Deloitte, "Global Chief Procurement Officer Survey 2025," 2025. deloitte.com
- KPMG, "Procurement Excellence in the Age of AI," 2025. kpmg.com
- PwC, "Procurement 2025: The Transformation Imperative," 2025. pwc.com
- Ernst & Young, "Future of Procurement: Strategic Value Creation," 2025. ey.com
- Accenture, "Supply Chain Resilience and Procurement Transformation," 2025. accenture.com
- Boston Consulting Group, "The Inflation-Proof Supply Chain," 2025. bcg.com
- Institute for Supply Management, "ISM Report on Business," 2025-2026. ismworld.org
- Procurement Leaders, "Tail Spend Benchmarking Report," 2025. procurementleaders.com
- Spend Matters, "Tail Spend Technology Landscape," 2025. spendmatters.com