Procurement cost reduction initiatives: the 3-wave maturity model
There is a well-documented progression in procurement cost reduction initiatives. Each wave builds on the previous — and each has a distinct savings profile.
Procurement policies, initial strategic sourcing events, tail spend consolidation.
Category management, supplier consolidation, specification optimization.
Value engineering, demand management, process automation — sustained indefinitely.
The pattern reveals an important truth: cost reduction is not a project. It is a capability. Organizations that treat it as a program with dedicated resources, governance, and performance management achieve 2-3x the savings of organizations that rely on episodic cost reduction initiatives. For a complementary framework on structuring initiatives across time horizons, see our 3-horizon playbook for procurement cost reduction initiatives.
Beyond Price: The Four Levers of Sustainable Cost Reduction
Price negotiation is the most visible cost reduction lever — but the least sustainable. Once the price is negotiated, the savings are captured and cannot be repeated. Sustainable procurement cost reduction initiatives address four structural levers:
Zero-Based Budgeting: When It Works
BCG's analysis of zero-based budgeting in procurement found that it delivers 10–25% savings in indirect categories in the first year, with a 6–12 month payback period for implementation costs.
The risk of ZBB is implementation fatigue. Organizations that apply ZBB to every category every cycle burn out their procurement teams and internal stakeholders.
Avoiding the Headcount Trap
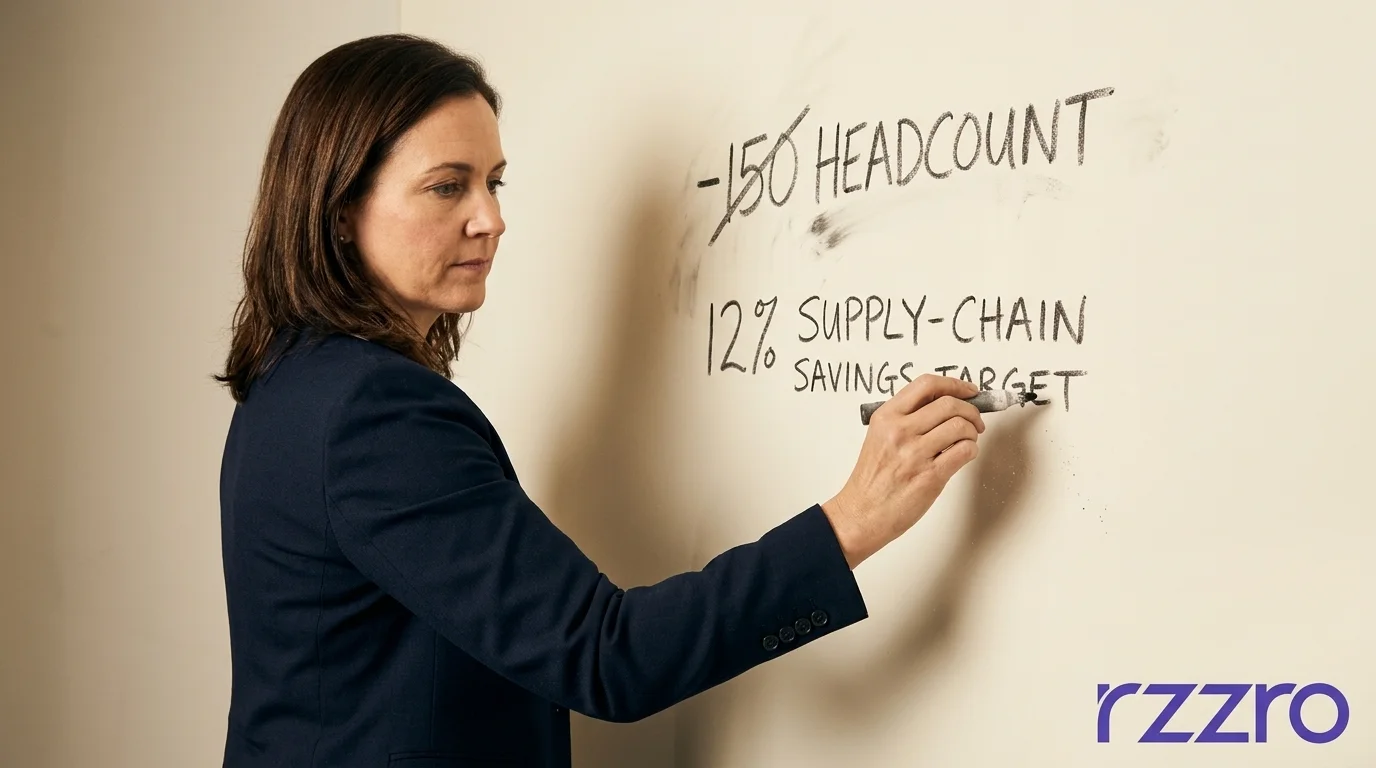
The most common cost reduction failure in procurement is headcount reduction without process or technology change. The math does not work:
- Cutting procurement headcount by 20% reduces operating costs by approximately 0.02% of managed spend.
- The resulting loss of category management capacity leads to 2–5% higher procurement costs — through unmanaged spend, missed savings opportunities, and supplier-driven price increases.
Total Cost of Ownership: The Correct Unit of Analysis
The most common mistake in procurement cost reduction is focusing on unit price rather than total cost of ownership. Here is a real example:
+ $0.12 shipping
+ $0.06 duties
+ $0.09 inventory carrying
+ $0.05 quality inspection
+ $0.03 supplier management
True TCO: $1.35
+ $0.01 shipping
+ $0.00 duties
+ $0.02 quality inspection
True TCO: $1.18
Savings: $0.17/unit
The TCO framework covers three layers:
- Acquisition costs: Purchase price, shipping, duties, insurance.
- Ownership costs: Storage, inventory carrying, maintenance, training, quality control.
- End-of-life costs: Disposal, environmental remediation, transition costs.
For services, add transition costs, governance costs, and relationship management costs alongside the direct service fee. Organizations that use TCO as their primary cost analysis framework identify 8–15% additional savings opportunities compared to organizations that focus on unit price — McKinsey Procurement Cost Research.
Technology-Enabled Cost Reduction: Automation and Self-Service
The most scalable cost reduction lever is technology. The savings compound across transaction volume:
Beyond transactional automation, AI-powered spend analytics identifies savings opportunities that manual analysis would miss: maverick spend patterns, unused contract volume commitments, pricing discrepancies between similar suppliers, and category-level cost reduction opportunities.
Category-specific procurement cost reduction initiatives
The most effective cost reduction programs are category-specific rather than applying uniform targets. Each category has a distinct cost driver and requires a tailored approach:
- Professional Services: Rate card standardization, statement of work templates, fixed-fee structures.
- IT: License optimization, cloud consumption management, hardware lifecycle extension.
- Logistics: Mode optimization (ocean vs. air), route consolidation, carrier rationalization.
- Facilities: Preventive maintenance optimization, energy management, space utilization improvement.
- Manufacturing & Direct Materials: Value engineering, specification optimization, supplier development programs.
Sustainability-Driven Cost Reduction: The New Synergy
The old model treated cost reduction and sustainability as competing objectives. The emerging model recognizes that sustainability and cost reduction are aligned in many categories:
- Reducing energy consumption → reduces both carbon emissions and utility costs.
- Optimizing logistics routes → reduces both fuel consumption and transportation costs.
- Reducing packaging material → reduces both waste disposal costs and material procurement costs.
- Substituting virgin materials with recycled content → reduces both raw material costs and environmental impact.
McKinsey's research on sustainable procurement found that organizations integrating sustainability criteria into their cost reduction programs achieved 8–10% additional savings in categories with significant energy, material, or logistics components — compared to organizations that pursued cost reduction without sustainability considerations.
Supplier Collaboration for Cost Reduction
The most innovative cost reduction ideas come from suppliers, not from procurement teams. Suppliers have deeper knowledge of their own cost structures, production processes, and material markets. Leading procurement organizations establish structured supplier cost reduction programs:
- Quarterly cost reduction workshops with strategic suppliers — both organizations share cost data and identify joint reduction opportunities.
- Open-book costing for strategic components — suppliers share cost breakdowns; both parties work together to identify savings.
- Gain-sharing agreements — suppliers receive a percentage of the cost savings they help identify.
- Supplier innovation challenges — invite suppliers to propose cost reduction ideas across specific categories.
Organizing procurement cost reduction initiatives: the program structure
Sustainable cost reduction requires a dedicated program structure. The most effective approach establishes a Cost Reduction Office within procurement — separate from day-to-day category management — with its own resources, targets, and governance.
The office: Led by a senior procurement leader with 3–5 dedicated cost reduction managers, each responsible for a category cluster.
The pipeline: 20–30 initiatives at various stages. Always maintain 2–3× more initiative value at the identification stage than the annual target — to account for initiatives that fail at qualification or execution.
Each stage has defined gates and criteria for progression. The pipeline is reviewed monthly by the cost reduction lead and quarterly by the CPO.
What is the sustainable cost reduction target for procurement?
Hackett Group benchmarks show top-quartile procurement organizations deliver 8–12% annual cost reduction consistently, while average organizations achieve 3–5%. The difference is program maturity, not market conditions. A structured portfolio of procurement cost reduction initiatives across quick wins, structural changes, and strategic transformation is the proven path to top-quartile performance.
How do you reduce costs without damaging supplier relationships?
Through value engineering (specification changes), demand management (consumption reduction), supply base consolidation (volume leverage), and process efficiency (lower transaction costs) — not unilateral price cuts. The most effective procurement cost reduction initiatives treat suppliers as partners in cost optimization, not adversaries in negotiation.
What is zero-based budgeting in procurement?
ZBB requires every category to justify its spend from zero each cycle, rather than incrementing from previous year's baseline. Applied to indirect categories, ZBB typically yields 10–25% savings in year one, with a 6–12 month payback period for implementation costs. BCG's analysis shows ZBB is most effective for discretionary categories like professional services, marketing, and IT.
How should procurement cost reduction initiatives be organized?
A dedicated Cost Reduction Office with 3–5 managers, clear category-level targets, monthly savings tracking, and executive sponsorship. The most successful programs maintain a pipeline of 20–30 initiatives at various stages and separate savings into hard (P&L-visible) and soft categories. McKinsey research shows structured pipelines achieve 90%+ savings realization rates vs. 50–60% for ad hoc approaches.
What is the most common failure in procurement cost reduction?
Chasing one-time savings without building sustainable capabilities. Companies that cut headcount and freeze strategic projects in downturns end up with higher costs when demand returns. McKinsey found companies relying on headcount reduction in the 2008 downturn took 3.8 years to recover, compared to 1.6 years for those investing in process and technology changes.
Sources
- Hackett Group — Procurement Benchmarking and Performance Metrics (2025)
- McKinsey — A New Era for Procurement: Value Creation Across the Supply Chain (2024)
- BCG — Zero-Based Budgeting in Procurement: When It Works (2024)
- SAP — 10 Proven Procurement Cost Savings Strategies (2025)
- Ivalua — Procurement Savings Management: Tactics to Cut Costs (2025)
- Sievo — How to Build a Procurement Cost Reduction Strategy (2025)
- IBM — Procurement Cost Reduction Strategies (2025)
- Sirion — Cost Saving Strategies in Procurement
- Coupa — 15 Procurement Cost Saving Strategies for Stronger Margins (2025)
- Varisource — Cost Reduction Procurement: 15 Strategies for 2026